Best Assisted Living Facilities in Greenville, AL
Find local assisted living and retirement communities in the Greenville, AL area.
Whether you're a resident of Greenville, Alabama, or considering relocating for senior care, there are several options available to suit various needs and budgets. With three senior living facilities in Greenville and a senior population constituting about 36%, the demand for quality care is evident. In Greenville, the average cost of assisted living is $3,461 per month, making it an affordable choice compared to state and national averages. This guide will discuss the best assisted living options available in Greenville, helping you find the right environment for your loved one to enjoy their golden years.
- Adult Day Services
- Assisted Living
- Home Care
- Independent Living
- Memory Care
- Nursing Home
- Residential Care Home
- Senior Apartments
- Distance from City Center
- Highest Rating
- Name: A - Z
- Name: Z - A

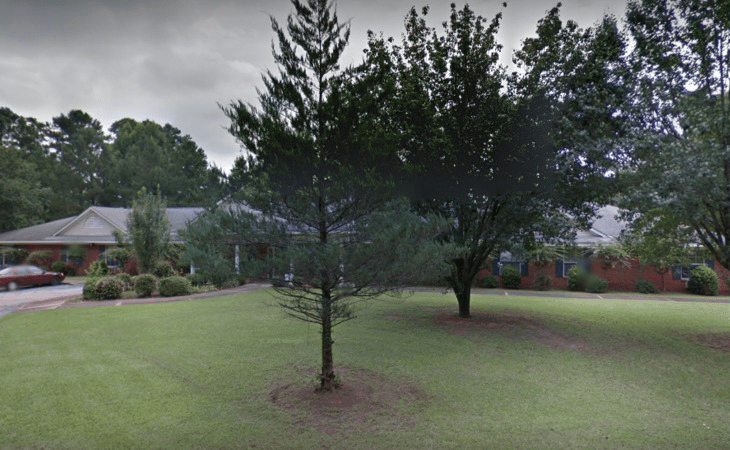
Pine Needle of Greenville
600 Glendale Ave, Greenville, AL 36037 (0.8 mi from city center)Pine Needle of Greenville is a 16-resident assisted living facility providing individualized personal care with a focus on emotional, physical, and spiritual wellness.

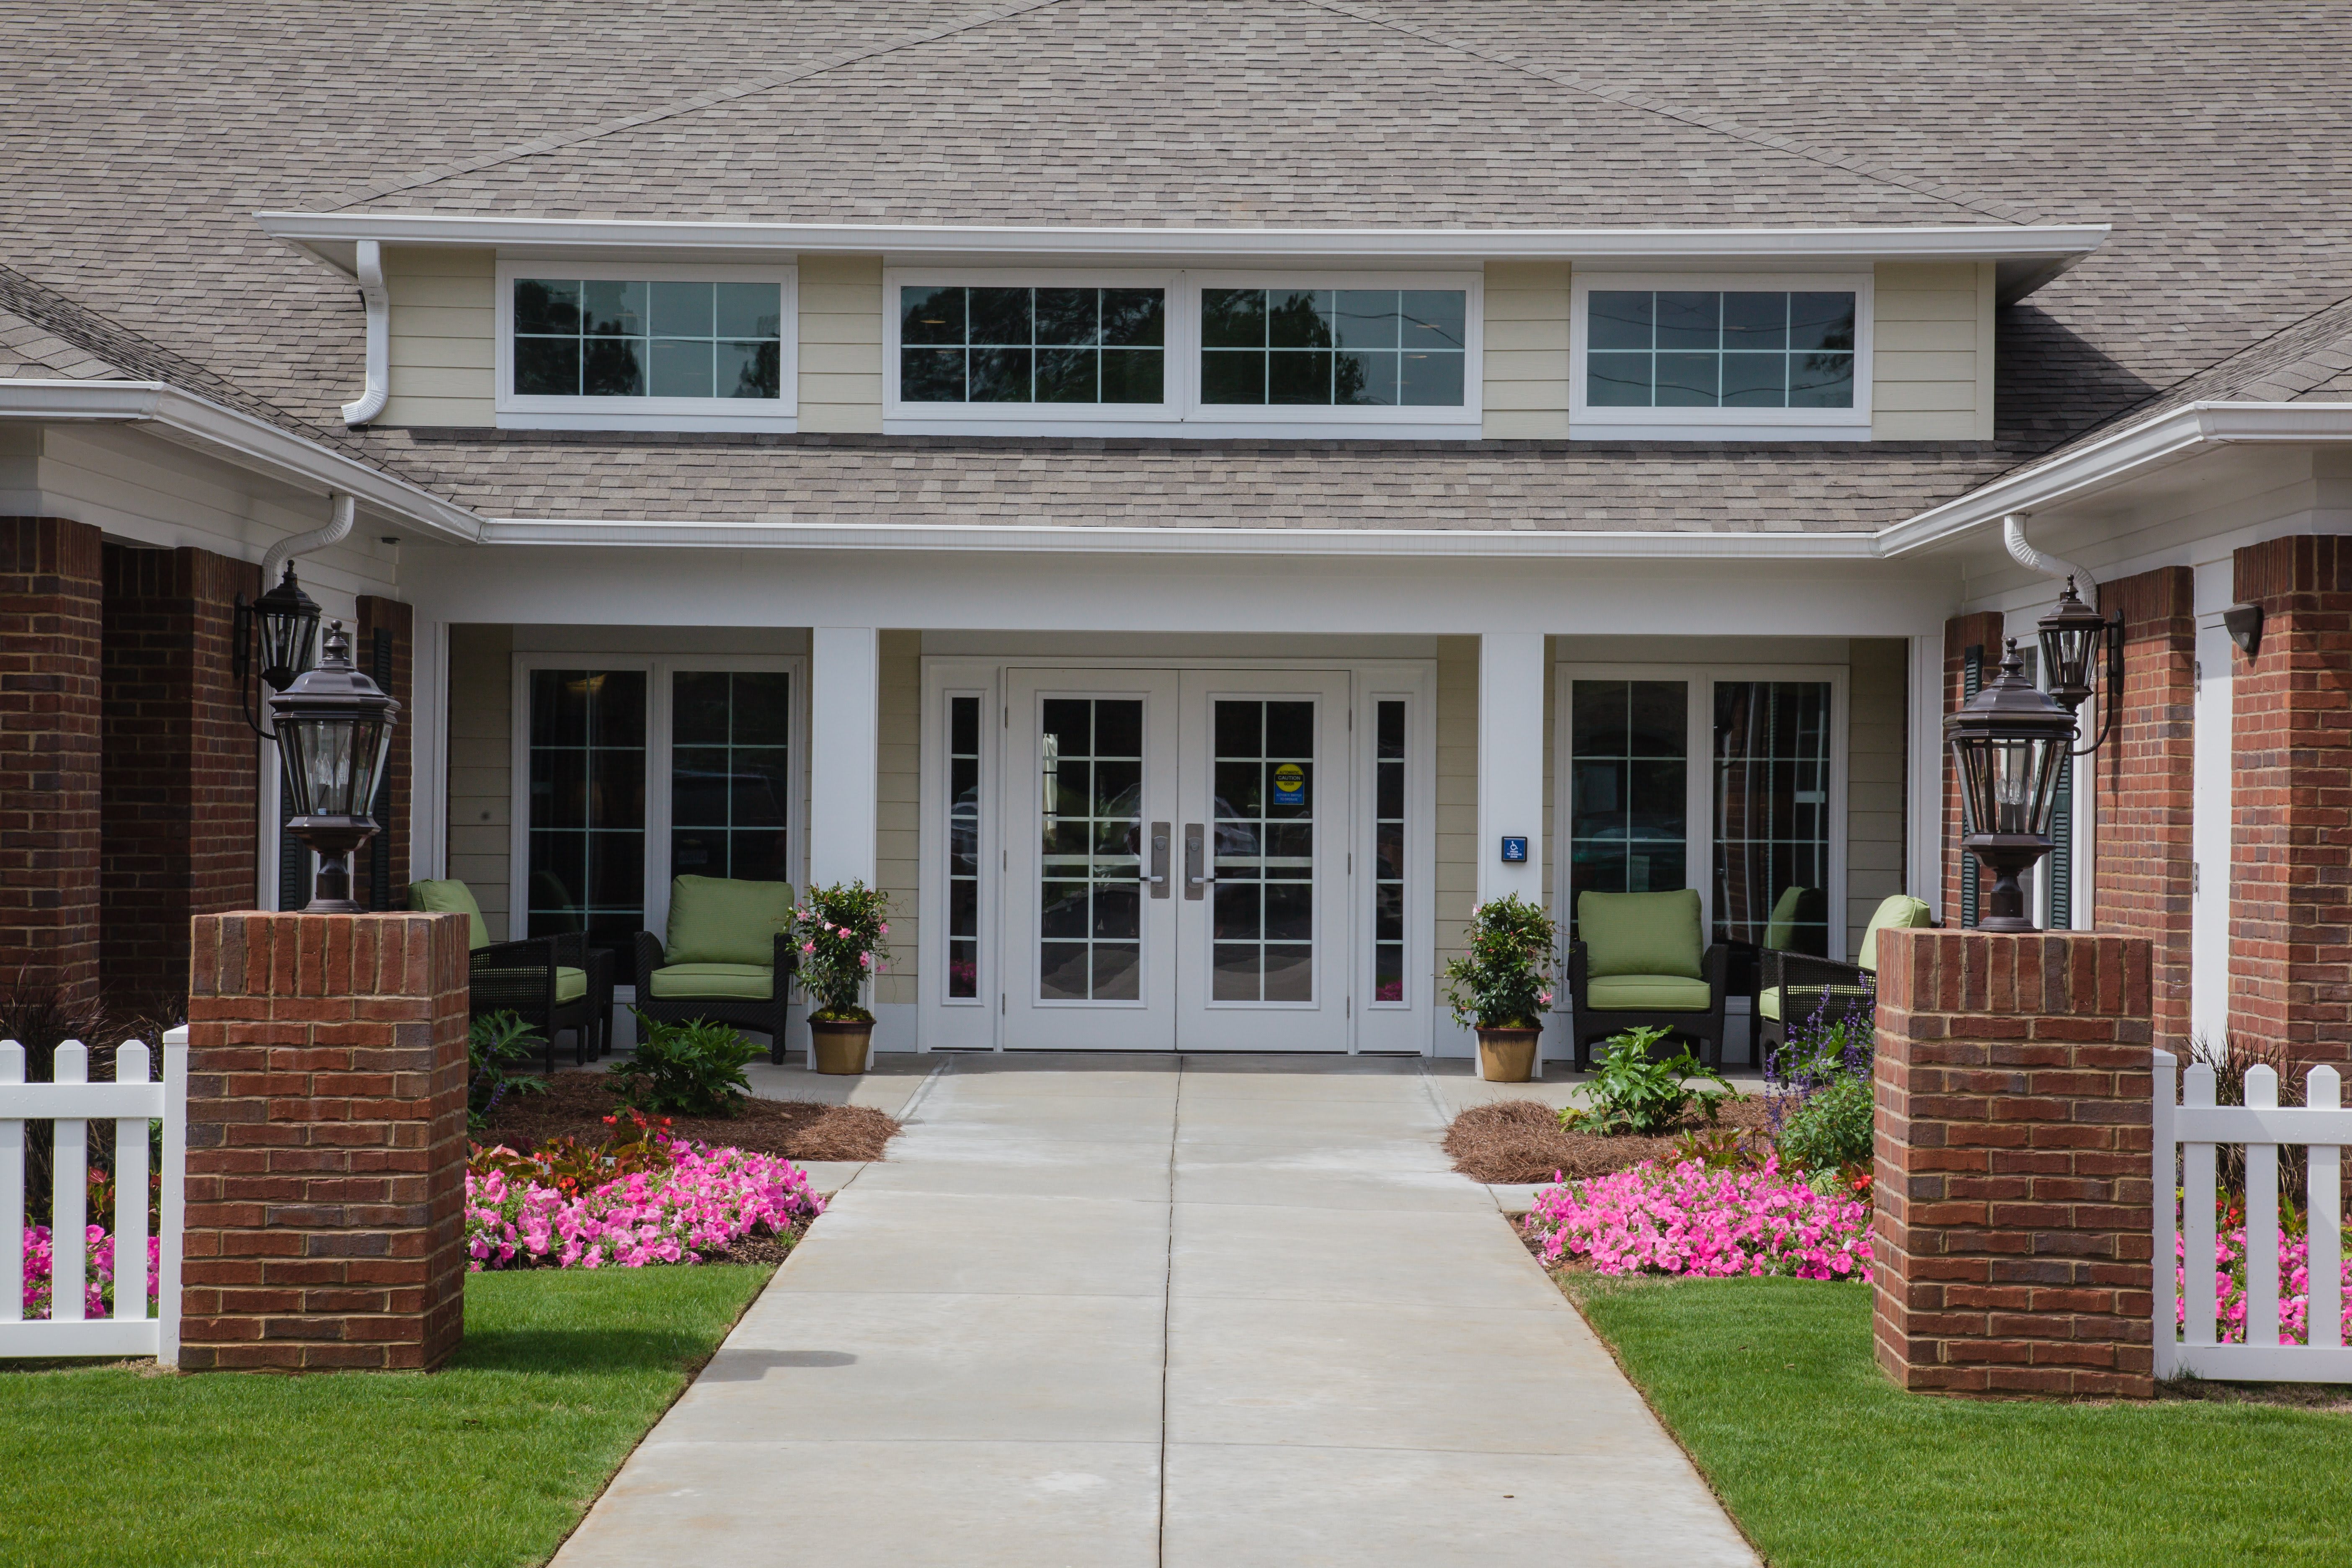
Country Place Senior Living of Greenville
1035 Fort Dale Road, Greenville, AL 36037 (0.8 mi from city center)Country Place Senior Living in Greenville, AL provides a maintenance-free assisted living experience with a focus on centering care around each resident’s specific needs.

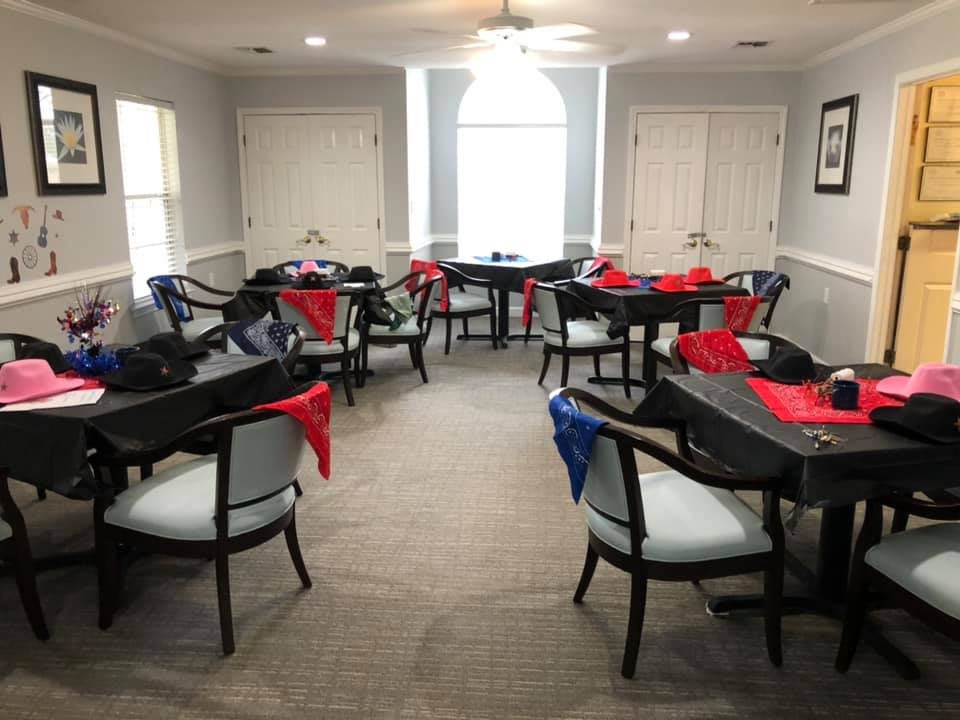
Country Place Memory Care of Greenville
3108 Luverne Hwy, Greenville, AL 36037 (3.8 mi from city center)Country Place Memory Care of Greenville provides comprehensive memory care services in a homelike environment.
Map of Assisted Living in Greenville
Find the right senior living community by location- Pine Needle of Greenville
- Country Place Senior Living of Greenville
- Country Place Memory Care of Greenville
Senior Living Statistics for Greenville, Alabama
Average Senior Living Costs by Housing Type
If you're looking for the least expensive senior living option in Greenville, Alabama, it's independent living, which costs an average of $2,693 per month. Costs for care range up to $5,458 per month for a studio in a nursing home. There are several other types of care to choose from, including assisted living, which costs $3,461 per month, and memory care, at $3,676 per month. Nursing home options include a private room for $4,576 and a semi-private room for $4,322. These options cater to various care needs and financial plans in Greenville.
| Housing Type | Average Monthly Cost |
|---|---|
| Assisted Living | $3,461 |
| Memory Care | $3,676 |
| Independent Living | $2,693 |
| Nursing Home: Private Room | $4,576 |
| Nursing Home: Semi-Private Room | $4,322 |
| Nursing Home: Studio | $5,458 |
Average Cost of Assisted Living in Greenville
The average cost of assisted living is $3,461 per month in Greenville, Alabama. This is more expensive than nearby cities, including Brantley and Glenwood, which cost an average of $3,062 per month each.
| City | Average Monthly Cost |
|---|---|
| Greenville | $3,461 |
| Brantley | $3,062 |
| Glenwood | $3,062 |
Here is how the average cost of assisted living in Greenville compares to Alabama and the national average:
| Area | Average Monthly Cost |
|---|---|
| Greenville | $3,461 |
| Alabama | $3,798 |
| United States | $4,546 |
Senior Living Availability in Greenville
Greenville offers 3 of the 237 senior living communities in Alabama. If you decide to extend your search beyond Greenville, you'll find that there are no additional facilities in the immediate surrounding area. However, Alabama still provides a broad selection overall, presenting various options for senior living in the state.
Greenville
Surrounding Area
Alabama
Greenville Senior Demographics
In Greenville, Alabama, seniors make up a significant 36% of the population of 7,326 people. This demographic is composed of 52.4% women and 47.6% men. Among seniors, 11.3% are in their 50s, 13.2% are in their 60s, 6.6% are in their 70s, and 4.9% are 80 and over. Regarding marital status, 39.8% of seniors are married, 15.6% divorced, 37.8% have never married, and 6.9% are widowed. The town is marked by its racial diversity, with 61.6% of the population identifying as Black, 32.8% as White, 3.3% as Asian, 1.9% as mixed race, and 1.6% as Hispanic, with 0.1% Native American and 0.3% identifying as other contributing to Greenville's multicultural composition.
Population
Greenville has a population of 7,326.- 47.6% Male
- 52.4% Female
Marital Status
- 39.8% Married
- 15.6% Divorced
- 37.8% Never Married
- 6.9% Widowed
Age
Seniors make up about 36% of the population.- 11.3% in their 50s
- 13.2% in their 60s
- 6.6% in their 70s
- 4.9% in their 80s
Diversity
- 32.8% White
- 61.6% Black
- 3.3% Asian
- 0.1% Native
- 0.3% Identifying as Other
- 1.9% Mixed Race
- 1.6% Hispanic
