Best Assisted Living Facilities in Torrington, CT
Find local assisted living and retirement communities in the Torrington, CT area.
In Torrington, Connecticut, seniors represent around 39.2% of the community, underscoring the critical need for reliable and supportive senior living options. Within the city, residents have access to two senior living facilities, with an additional four in the surrounding area, providing a variety of choices from independent and assisted living to memory care and different nursing home settings. The average cost for assisted living in Torrington is $8,483 per month, reflecting the quality of care and services offered. This guide highlights some of the premier senior living communities in Torrington, helping you navigate the emotional and important decisions needed to select the best care for you or your loved ones.
- Kent, CT
- Litchfield, CT
- Adult Day Services
- Assisted Living
- Home Care
- Independent Living
- Memory Care
- Nursing Home
- Residential Care Home
- Senior Apartments
- Distance from City Center
- Highest Rating
- Name: A - Z
- Name: Z - A

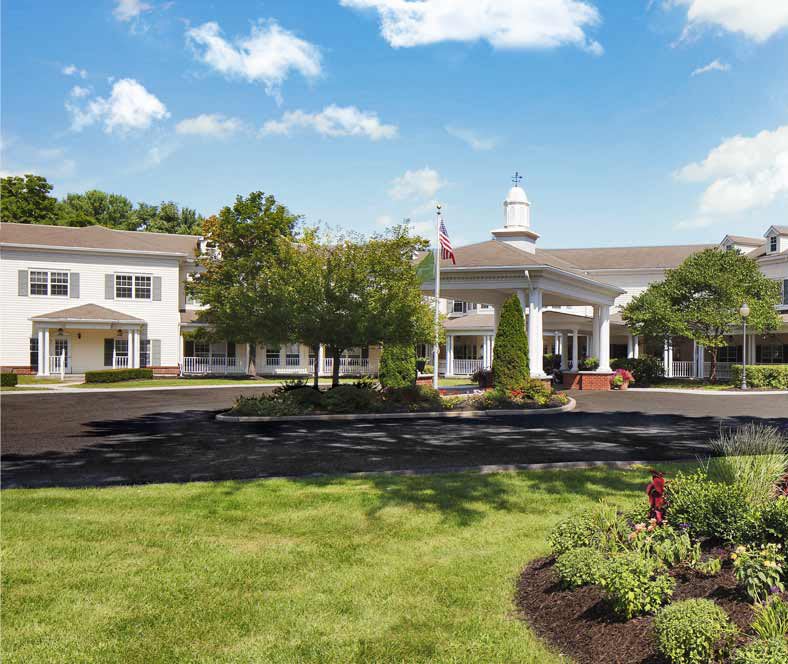
The Cottage at Litchfield Hills
376 Goshen Rd, Torrington, CT 06790 (1.7 mi from city center)The Cottage at Litchfield Hills offers Assisted Living and Memory Care with a focus on security, support, and a vibrant social atmosphere.

Keystone Place at Newbury Brook
1058 Litchfield St, Torrington, CT 06790 (3.3 mi from city center)Keystone Place at Newbury Brook is an independent and assisted living community with a memory care center offering a range of amenities and services.

Brandywine Living at Litchfield
19 Constitution Way, Litchfield, CT 06759 (7.5 mi from city center)Brandywine Living at Litchfield is a premier assisted living provider of quality care and services to seniors, dedicated to promoting independence, dignity, and individuality.

Morning Star Residential Care Home
38 Elizabeth St, Kent, CT 06757 (19.6 mi from city center)Morning Star Residential Care Home is an 18-bed Residential Care Home licensed by the Connecticut Department of Public Health.
Map of Assisted Living in Torrington
Find the right senior living community by location- The Cottage at Litchfield Hills
- Keystone Place at Newbury Brook
- Brandywine Living at Litchfield
- Morning Star Residential Care Home
Senior Living Statistics for Torrington, Connecticut
Average Senior Living Costs by Housing Type
Average senior living costs in Torrington, Connecticut, range from $4,145 per month for a detached cottage to $8,547 for memory care. There are plenty of options in between, including independent living at $6,431 per month and a nursing home studio at $6,118 per month. These varied options in Torrington provide a range of senior housing choices to suit different preferences and budgets.
| Housing Type | Average Monthly Cost |
|---|---|
| Assisted Living | $8,483 |
| Memory Care | $8,547 |
| Independent Living | $6,431 |
| Nursing Home: Private Room | $6,000 |
| Nursing Home: Semi-Private Room | $6,431 |
| Nursing Home: Studio | $6,118 |
| Nursing Home: One Bedroom | $6,476 |
| Nursing Home: Two Bedroom | $7,325 |
| Nursing Home: Detached Cottage | $4,145 |
Average Cost of Assisted Living in Torrington
The average cost of assisted living in Torrington is $8,483 per month. This is more expensive than other nearby cities, including Simsbury Center and New Hartford Center, which cost an average of $6,249 and $5,816 per month, respectively.
| City | Average Monthly Cost |
|---|---|
| Torrington | $8,483 |
| Simsbury Center | $6,249 |
| New Hartford Center | $5,816 |
Here is how the average cost of assisted living in Torrington compares to Connecticut and the national average:
| Area | Average Monthly Cost |
|---|---|
| Torrington | $8,483 |
| Connecticut | $9,364 |
| United States | $4,546 |
Senior Living Availability in Torrington
If you don't find the senior living option that's right for you in Torrington, there are many options outside of the city. There are 4 facilities to choose from in the surrounding area, while there are a total of 272 facilities in the entire state of Connecticut.
Torrington
Surrounding Area
Connecticut
Torrington Senior Demographics
In Torrington, Connecticut, seniors represent a substantial 39.2% of the population, which totals 35,510 people, favoring the females who comprise 51.1% versus 48.9% males. Looking into age distribution, 14.7% of the seniors are in their 50s, 13.4% in their 60s, 6.8% in their 70s, and 4.3% are aged 80 and over. Regarding marital status, 41.9% are married, while 13.9% are divorced, 36.3% have never been married, and 7.8% are widowed. The community's diversity includes 72.5% White, 17.5% Hispanic, 10.4% Black, and 3.4% Asian residents, alongside those of mixed race making up 8.6%, and 4.9% identifying as other, offering Torrington a rich blend of cultural backgrounds.
Population
Torrington has a population of 35,510.- 48.9% Male
- 51.1% Female
Marital Status
- 41.9% Married
- 13.9% Divorced
- 36.3% Never Married
- 7.8% Widowed
Age
Seniors make up about 39.2% of the population.- 14.7% in their 50s
- 13.4% in their 60s
- 6.8% in their 70s
- 4.3% in their 80s
Diversity
- 72.5% White
- 10.4% Black
- 3.4% Asian
- 0.2% Native
- 4.9% Identifying as Other
- 8.6% Mixed Race
- 17.5% Hispanic
Additional Cities with Assisted Living Near Torrington
Senior housing costs near Torrington, Connecticut, show a significant range. Kent offers a more affordable option with an average cost of $5,989 per month, whereas Litchfield is on the higher end at $8,489. This diversity in pricing allows for varying budget preferences when selecting senior living arrangements in the nearby area.
| City | Average Monthly Cost |
|---|
| City | Average Monthly Cost |
|---|---|
| Kent | $5,989 |
| City | Average Monthly Cost |
|---|---|
| Litchfield | $8,489 |
