Best Assisted Living Facilities in Rome, GA
Find local assisted living and retirement communities in the Rome, GA area.
Are you looking for senior living in the Rome area? There are plenty of options for high-quality care, ranging from assisted living to nursing homes. The average cost of assisted living in the area is $3,949 per month, though costs range depending on the facility, location, and level of care you need. Below, we will take a look at some of the top assisted living options in Rome so you can find the best care for your loved one.
- Cave Spring, GA
- ,
- Adult Day Services
- Assisted Living
- Home Care
- Independent Living
- Memory Care
- Nursing Home
- Residential Care Home
- Respite Care
- Senior Apartments
- Distance from City Center
- Highest Rating
- Name: A - Z
- Name: Z - A

ComForCare Home Care of Northwest Georgia
503 West 10th Street, Rome, GA 31065 (0.6 mi from city center)ComForCare Home Care of Northwest Georgia provides personalized home care services to help individuals with daily activities.

Riverwood Retirement Center
511 W 10th St NE, Rome, GA 30165 (0.6 mi from city center)Riverwood Retirement Center offers assisted living, memory care, and independent living services in Rome, GA.
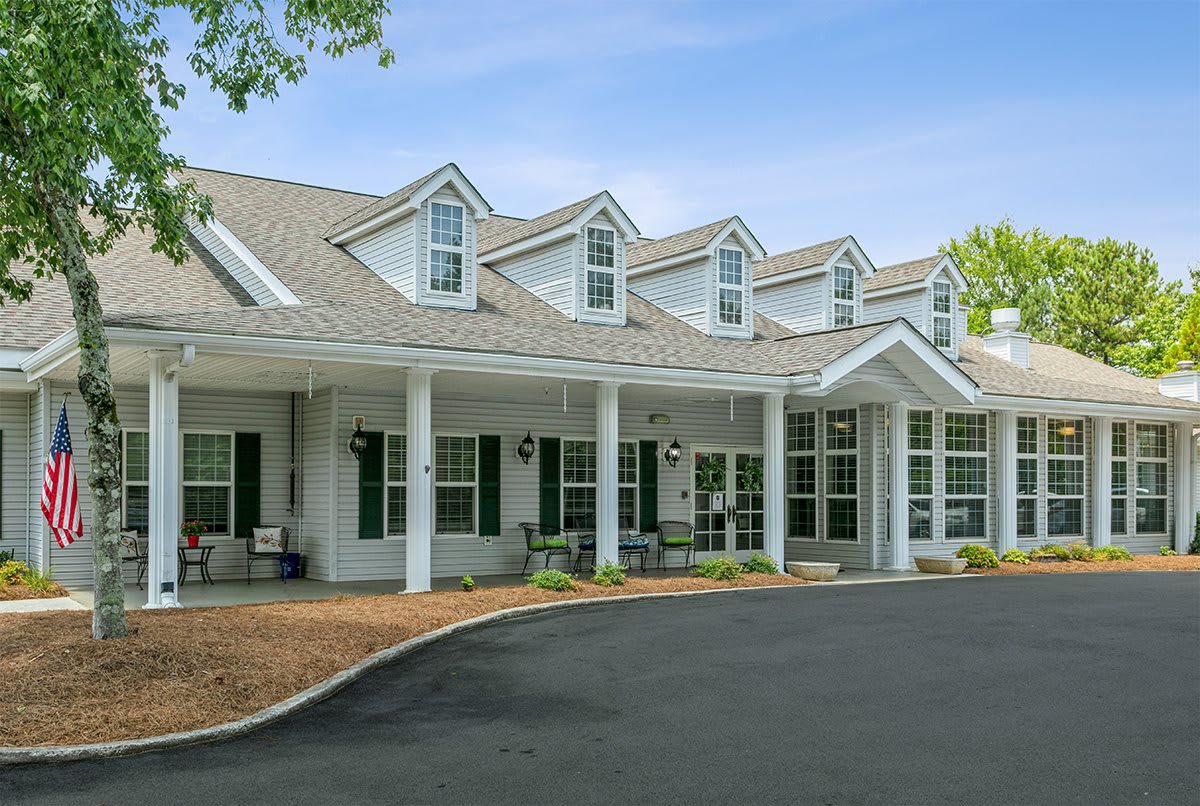
Seven Hills Square
279 Technology Pkwy NW, Rome, GA 30165 (2.3 mi from city center)Seven Hills Square is a Memory Care community located in Rome, GA, offering assisted living and memory care services.
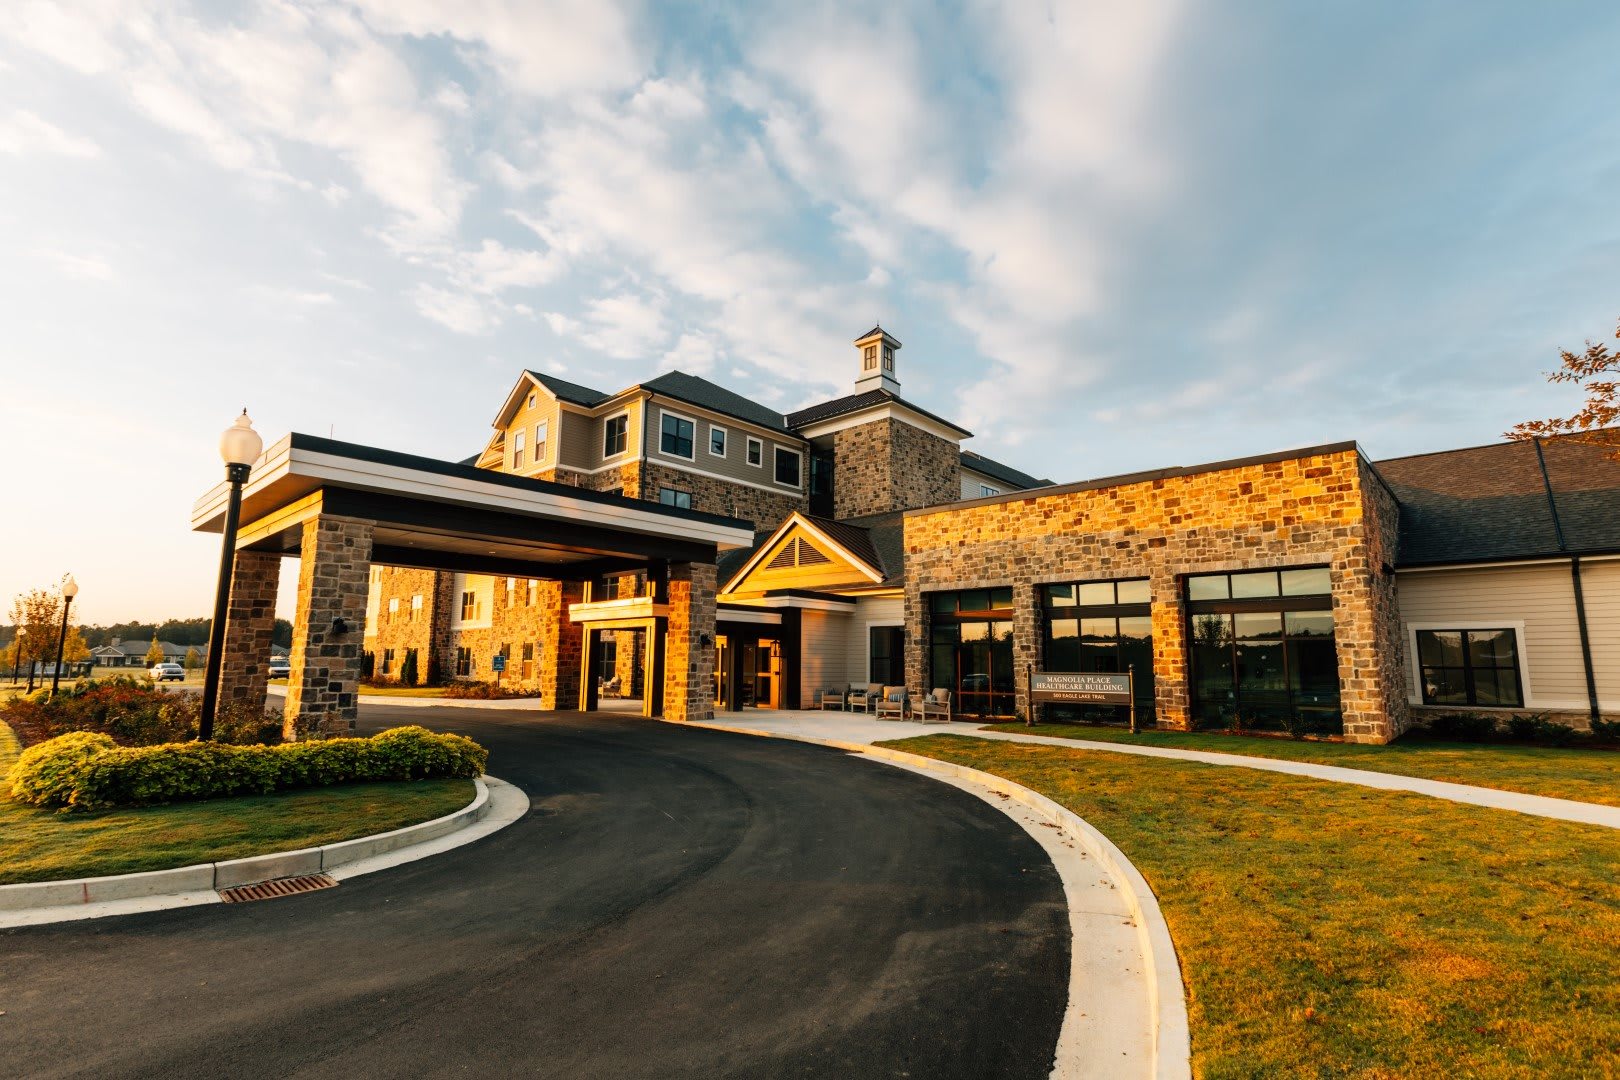
The Spires at Berry College
500 Eagle Lake Trail, Rome, GA 30165 (3.1 mi from city center)The Spires at Berry College is a senior living community offering a full spectrum of quality onsite healthcare, resort-style amenities, and a vibrant college campus setting within the city of Rome, Georgia.
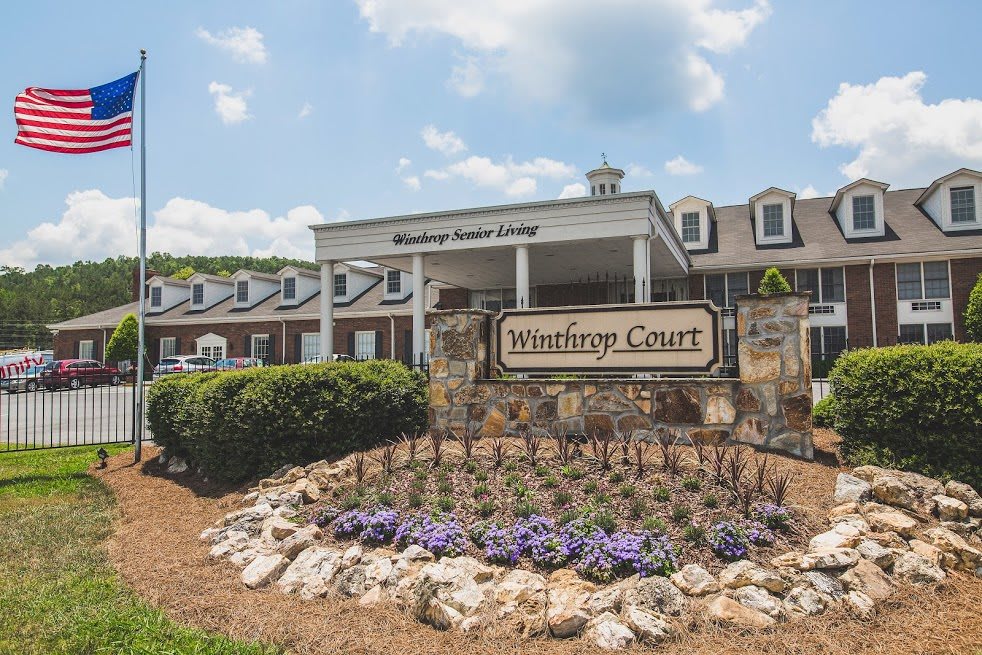
Greater Clarehouse Living
10 Highway 411 SE, Rome, GA 30161 (3.4 mi from city center)Greater Clarehouse Living is a senior living facility offering independent living, assisted living, and memory care services.
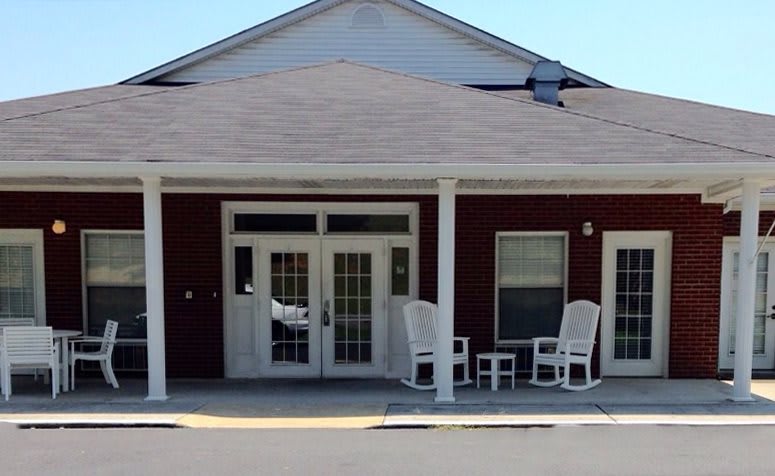
The Gardens of Rome
1168 Chulio Rd, Rome, GA 30161 (5.7 mi from city center)The Gardens of Rome is a senior living facility offering assisted living and memory care services in Rome, GA.
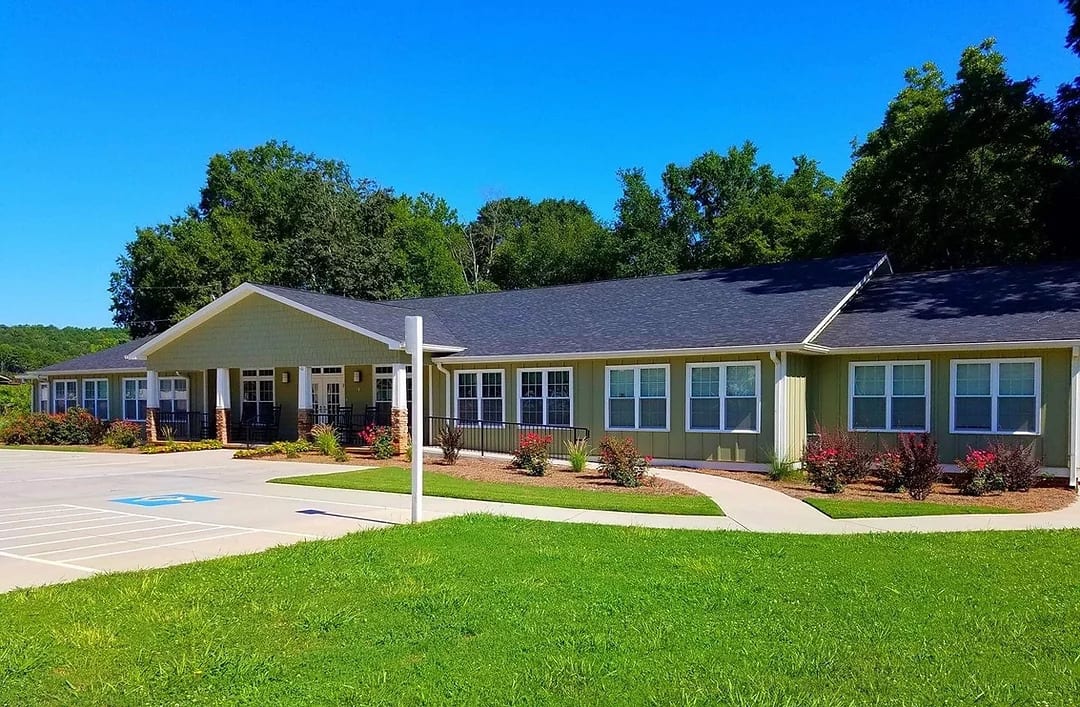
Cave Spring Manor
44 Alabama Street, Cave Spring, GA 30124 (14.1 mi from city center)Cave Spring Manor delivers an unmatched quality of care at its senior living community in Cave Spring, Georgia.
Map of Assisted Living in Rome
Find the right senior living community by location- ComForCare Home Care of Northwest Georgia
- Riverwood Retirement Center
- Seven Hills Square
- The Spires at Berry College
- Greater Clarehouse Living
- The Gardens of Rome
- Cave Spring Manor
Senior Living Statistics for Rome, Georgia
Average Senior Living Costs by Housing Type
The least expensive type of senior living in Rome, Georgia is independent living, which costs $3,918 per month on average, while the most expensive option is a one-bedroom unit in a nursing home, costing $5,657 per month. There are many other types of care at various price points, including assisted living, memory care, a private nursing home room, a semi-private nursing home room, and a studio unit in a nursing home.
| Housing Type | Average Monthly Cost |
|---|---|
| Assisted Living | $3,949 |
| Memory Care | $3,949 |
| Independent Living | $3,918 |
| Nursing Home: Private Room | $4,064 |
| Nursing Home: Semi-Private Room | $4,000 |
| Nursing Home: Studio | $5,223 |
| Nursing Home: One Bedroom | $5,657 |
Average Cost of Assisted Living in Rome
The average cost of assisted living communities in Rome is 3949 per month. For comparison, nearby cities LaFayette and Resaca cost $3,287 per month and $3,464 per month, respectively. Additionally, Rome is above the Georgia state average of $3,583 but falls below the nationwide average of $4,546 per month.
| City | Average Monthly Cost |
|---|---|
| Rome | $3,949 |
| LaFayette | $3,287 |
| Resaca | $3,464 |
Here is how the average cost of assisted living in Rome compares to Georgia and the national average:
| Area | Average Monthly Cost |
|---|---|
| Rome | $3,949 |
| Georgia | $3,583 |
| United States | $4,546 |
Senior Living Availability in Rome
Rome offers several options for senior living communities - 6 to be exact. For those who are not set on living in Rome, there are 7 facilities in the surrounding area and 791 throughout Georgia.
Rome
Surrounding Area
Georgia
Rome Senior Demographics
The population of Rome consists of 46.9% male and 53.1% female residents. Seniors account for 32.4% of the population, with 11.5% in their 50s, 10.1% in their 60s, 6.7% in their 70s, and 4.1% over 80. Regarding marital status, 40.1% are married, 14.9% are divorced, 38.8% have never married, and 6.1% are widowed. The community's diversity includes 54.8% White, 20.3% Hispanic, 24.8% Black, and 11.3% identifying as mixed race.
Population
Rome has a population of 37,754.- 46.9% Male
- 53.1% Female
Marital Status
- 40.1% Married
- 14.9% Divorced
- 38.8% Never Married
- 6.1% Widowed
Age
Seniors make up about 32.4% of the population.- 11.5% in their 50s
- 10.1% in their 60s
- 6.7% in their 70s
- 4.1% in their 80s
Diversity
- 54.8% White
- 24.8% Black
- 1.8% Asian
- 1% Native
- 6.3% Identifying as Other
- 11.3% Mixed Race
- 20.3% Hispanic
Additional Cities with Assisted Living Near Rome
The average cost of senior living in Rome, Georgia is comparable to nearby Cave Spring ($3,504 per month).
