Best Assisted Living Facilities in Mount Vernon, IL
Find local assisted living and retirement communities in the Mount Vernon, IL area.
Mount Vernon, Illinois, provides a welcoming environment for its senior community, which makes up about 36.5% of the city's population. Catering to diverse needs and preferences, the city offers three senior living facilities, with an additional three located in nearby areas. Assisted living in Mount Vernon averages $4,477 per month, and there are a variety of housing options ranging from independent living to nursing care. In this article, we will explore the top senior living options in Mount Vernon, highlighting facilities known for their outstanding services, amenities, and overall value to ensure your loved one finds the perfect home.
- Adult Day Services
- Assisted Living
- Home Care
- Independent Living
- Memory Care
- Nursing Home
- Residential Care Home
- Senior Apartments
- Distance from City Center
- Highest Rating
- Name: A - Z
- Name: Z - A

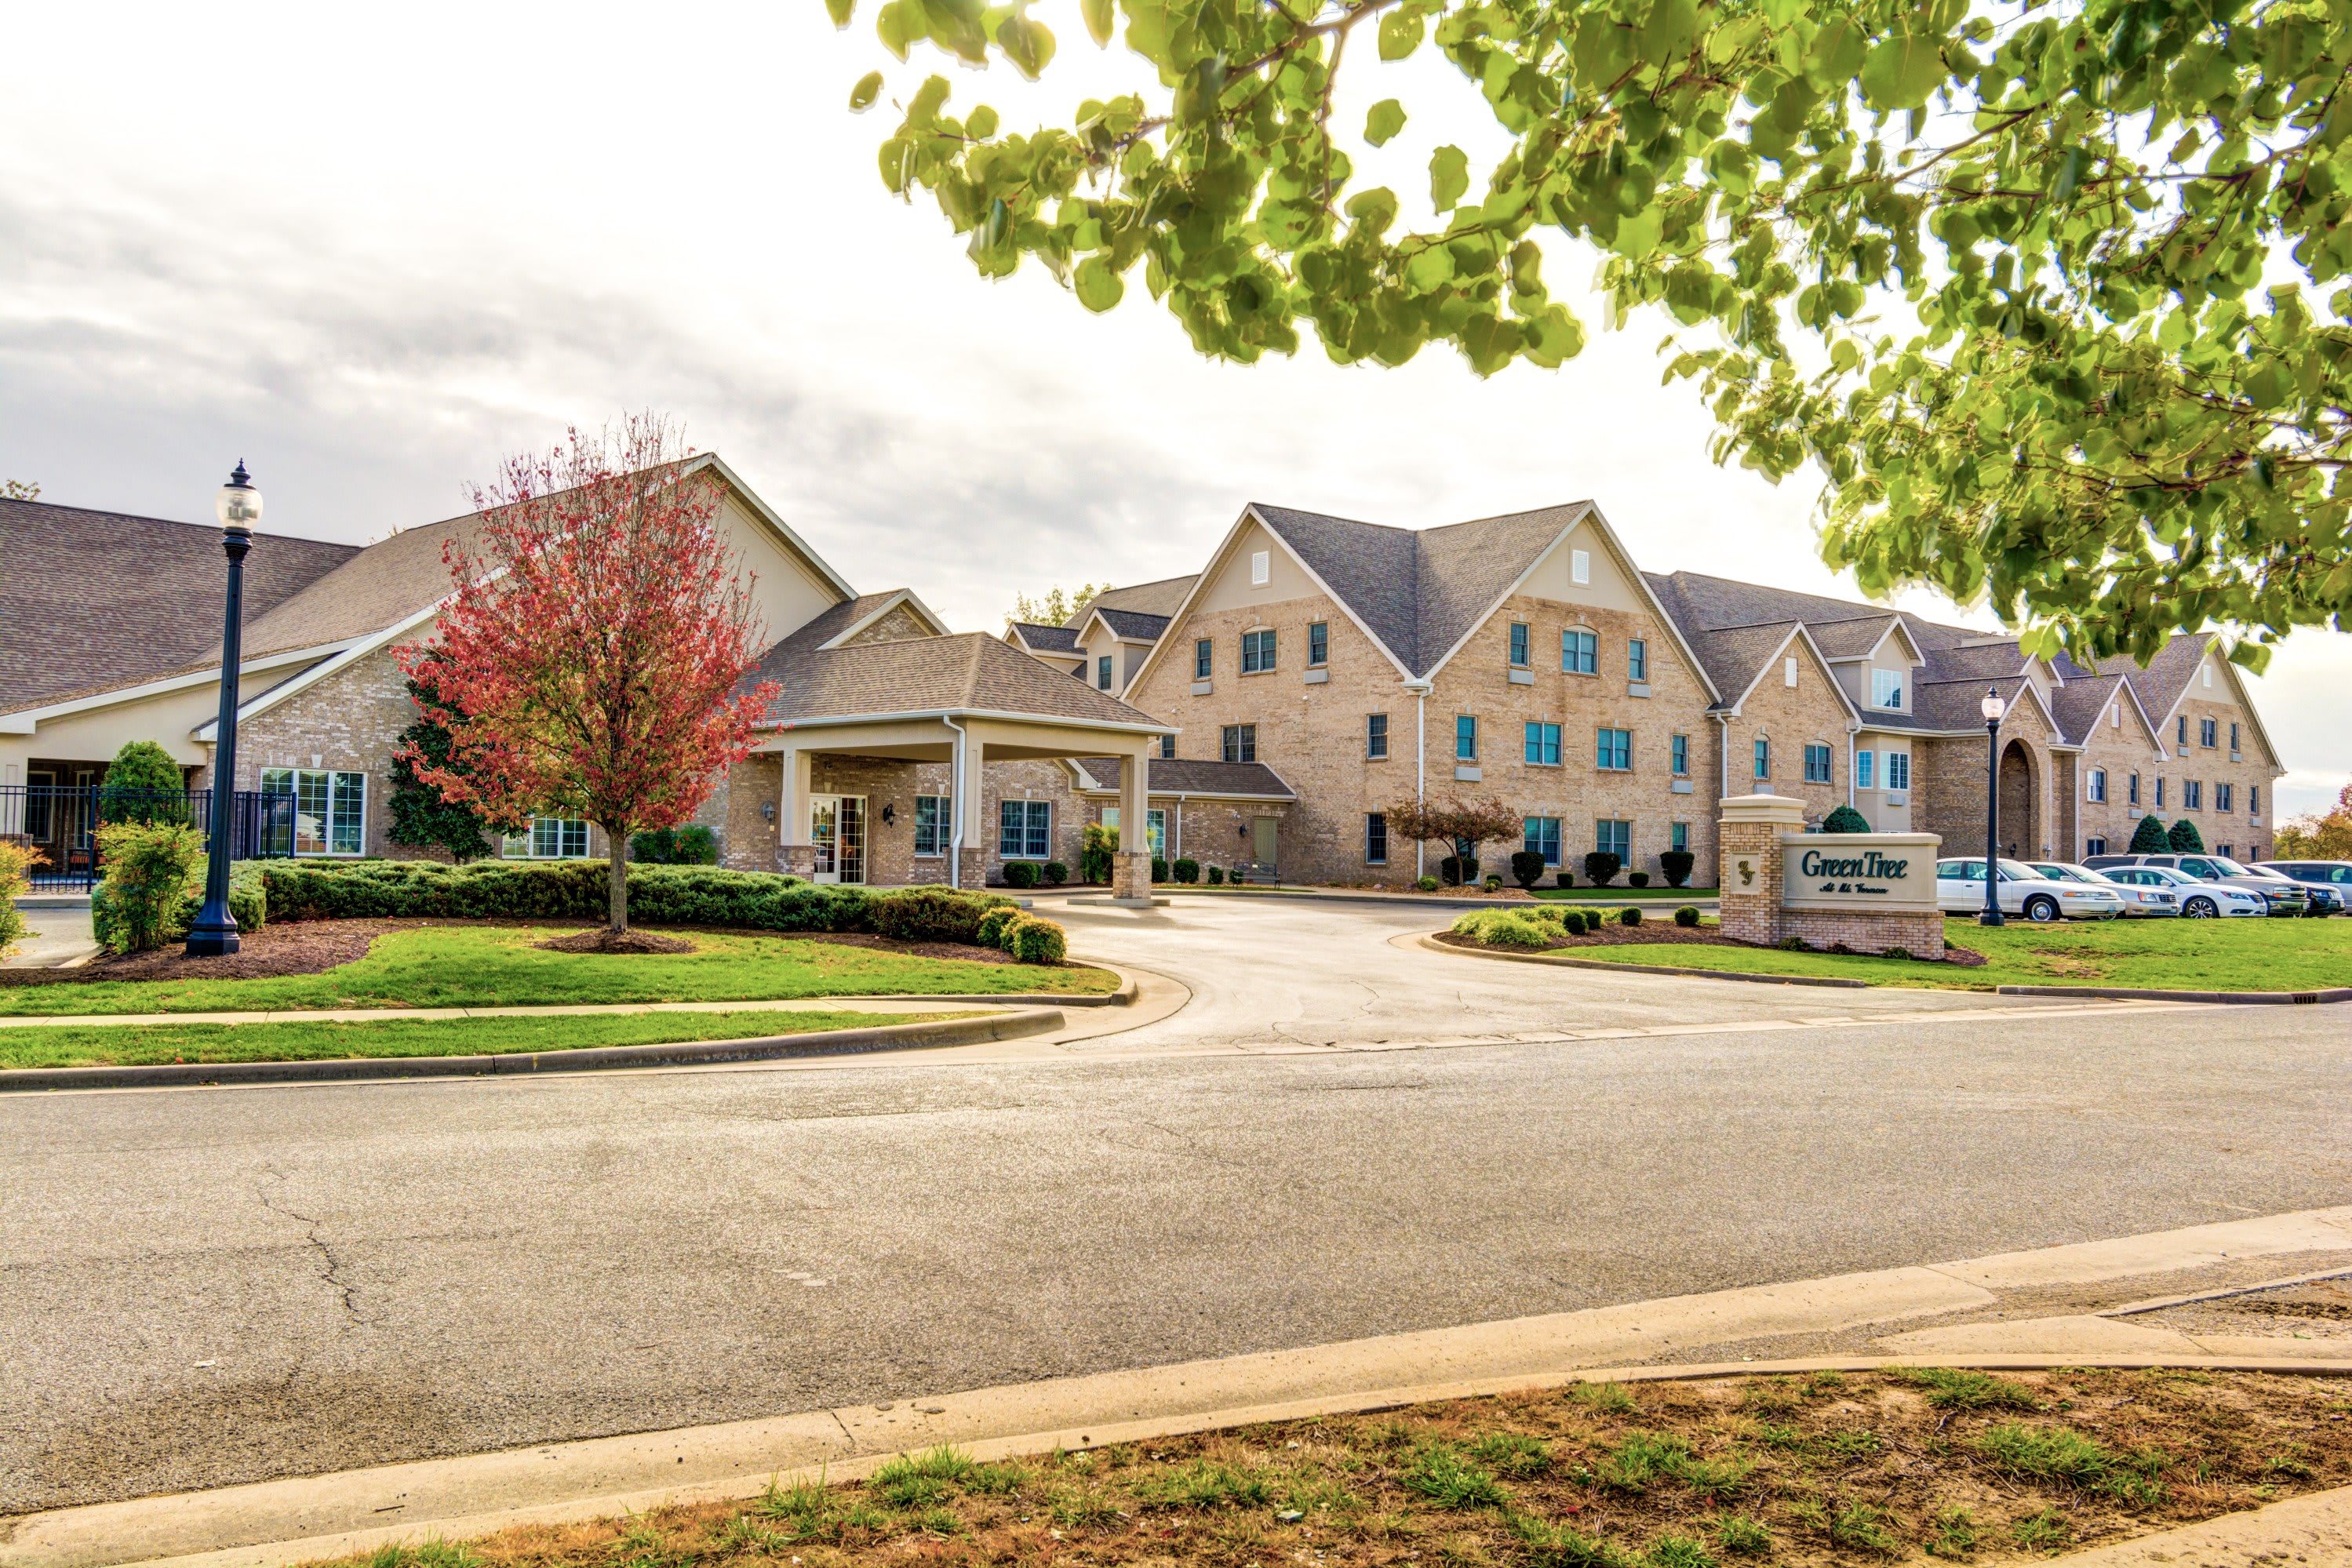
GreenTree at Mt. Vernon
208 Zachery Dr, Mount Vernon, IL 62864 (2.5 mi from city center)Map of Assisted Living in Mount Vernon
Find the right senior living community by location- Heritage Woods of Mt Vernon
- GreenTree at Mt. Vernon
Senior Living Statistics for Mount Vernon, Illinois
Average Senior Living Costs by Housing Type
If you're looking for the least expensive senior living option in Mount Vernon, Illinois, it's independent living, which costs an average of $4,008 per month. Costs for care range up to $5,463 per month for a one-bedroom nursing home unit. There are several other types of care to choose from, including assisted living and memory care, both averaging $4,477 per month. For nursing home accommodations, a private room costs $5,044, a semi-private room is priced at $5,289, and a studio averages $4,416 per month. This range of options can help you find something that suits your needs and budget.
| Housing Type | Average Monthly Cost |
|---|---|
| Assisted Living | $4,477 |
| Memory Care | $4,477 |
| Independent Living | $4,008 |
| Nursing Home: Private Room | $5,044 |
| Nursing Home: Semi-Private Room | $5,289 |
| Nursing Home: Studio | $4,416 |
| Nursing Home: One Bedroom | $5,463 |
Average Cost of Assisted Living in Mount Vernon
When compared to the nationwide average for assisted living costs ($4,546 per month), Mount Vernon is slightly less expensive at $4,477 per month. On the other hand, assisted living in Mount Vernon is more expensive than other nearby cities, such as Ewing ($3,896 per month) and Keenes ($3,900 per month).
| City | Average Monthly Cost |
|---|---|
| Mount Vernon | $4,477 |
Here is how the average cost of assisted living in Mount Vernon compares to Illinois and the national average:
| Area | Average Monthly Cost |
|---|---|
| Mount Vernon | $4,477 |
| Illinois | $5,101 |
| United States | $4,546 |
Senior Living Availability in Mount Vernon
Mount Vernon offers several options for senior living communities - 3 to be exact. For those who are not set on living in Mount Vernon, there are 3 facilities in the surrounding area and 810 throughout Illinois.
Mount Vernon
Surrounding Area
Illinois
Mount Vernon Senior Demographics
In Mount Vernon, Illinois, seniors comprise a notable 36.5% of the 14,740 residents. Of this senior population, 11.3% are in their 50s, 11% in their 60s, 7.8% in their 70s, and 6.4% fall into the 80 and over age group. The overall demographics indicate a slight female majority, with 50.7% females compared to 49.3% males. Marital status distribution reveals that 40.4% of residents are married, 15.7% are divorced, 35.7% have never married, and 8.2% are widowed. In terms of diversity, Mount Vernon's population is predominantly White at 77.5%, followed by 12.6% Black, 7.8% mixed race, and 4.5% Hispanic. Additional subgroups include 0.6% identifying as other, 1.4% Asian, and a minimal 0.1% Native American, reflecting a diverse community backdrop.
Population
Mount Vernon has a population of 14,740.- 49.3% Male
- 50.7% Female
Marital Status
- 40.4% Married
- 15.7% Divorced
- 35.7% Never Married
- 8.2% Widowed
Age
Seniors make up about 36.5% of the population.- 11.3% in their 50s
- 11% in their 60s
- 7.8% in their 70s
- 6.4% in their 80s
Diversity
- 77.5% White
- 12.6% Black
- 1.4% Asian
- 0.1% Native
- 0.6% Identifying as Other
- 7.8% Mixed Race
- 4.5% Hispanic

