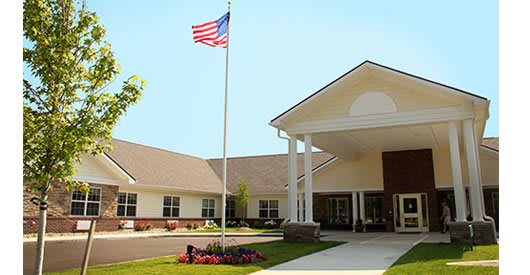
Best Assisted Living Facilities in Greensburg, IN
Find local assisted living and retirement communities in the Greensburg, IN area.
The average monthly cost of assisted living is $3,671 in Greensburg, and there are a variety of senior living options to meet the needs of the city's older residents. Whether you're looking for independent living, assisted living, nursing homes, or memory care, you can rest easy knowing there are 3 different facilities to choose from that will cater to your needs. In this guide, we'll take a closer look at the best assisted living options, so you can find the right community for your loved one.
3 Communities were found near Greensburg, IN
City
Care Type
- Adult Day Services
- Assisted Living
- Home Care
- Independent Living
- Memory Care
- Nursing Home
- Residential Care Home
- Respite Care
- Senior Apartments
- Distance from City Center
- Highest Rating
- Name: A - Z
- Name: Z - A
Map of Assisted Living in Greensburg
Find the right senior living community by location- Grace Luthern Manor
- Aspen Place Health Campus
- Arbor Grove Village
Senior Living Statistics for Greensburg, Indiana
Average Senior Living Costs by Housing Type
Greensburg, Indiana offers a variety of senior housing options to meet diverse needs. The most expensive choice is a one-bedroom unit in a nursing home, averaging $4,850 per month. Meanwhile, the least expensive option is a semi-private room, averaging $2,490 per month. Independent living remains an accessible option at $3,065 per month, while memory care and other nursing home units are on the pricier side.
| Housing Type | Average Monthly Cost |
|---|---|
| Assisted Living | $3,671 |
| Memory Care | $4,111 |
| Independent Living | $3,065 |
| Nursing Home: Private Room | $3,460 |
| Nursing Home: Semi-Private Room | $2,490 |
| Nursing Home: Studio | $3,875 |
| Nursing Home: One Bedroom | $4,850 |
Average Cost of Assisted Living in Greensburg
Greensburg assisted living communities cost 3671 per month on average. This is slightly more expensive than average costs in nearby cities like Glenwood and New Point, which cost $3,170 per month and $3,191 per month, respectively. However, Greensburg is below the state average in Indiana ($3,843) and significantly lower than the national average of $4,546.
| City | Average Monthly Cost |
|---|---|
| Greensburg | $3,671 |
| Glenwood | $3,170 |
| New Point | $3,191 |
Here is how the average cost of assisted living in Greensburg compares to Indiana and the national average:
| Area | Average Monthly Cost |
|---|---|
| Greensburg | $3,671 |
| Indiana | $3,843 |
| United States | $4,546 |
Senior Living Availability in Greensburg
In Greensburg, there are 3 senior living communities. For those who aren't set on Greensburg, there are 3 facilities in the surrounding area and 501 in the state of Indiana.
3
Greensburg
3
Surrounding Area
501
Indiana
Greensburg Senior Demographics
The Greensburg population comprises 47.7% male and 52.3% female residents. Seniors represent 36% of the total population, with 10.6% in their 50s, 10% in their 60s, 10% in their 70s, and 5.4% over 80. Marital demographics show 48.8% married, 14.3% divorced, 28.2% never married, and 8.6% widowed. Regarding diversity, 90.9% are White, 0.5% are Black, 0.8% are Native American, and 4.4% are Hispanic.
Population
Greensburg has a population of 11,585.- 47.7% Male
- 52.3% Female
Marital Status
- 48.8% Married
- 14.3% Divorced
- 28.2% Never Married
- 8.6% Widowed
Age
Seniors make up about 36% of the population.- 10.6% in their 50s
- 10% in their 60s
- 10% in their 70s
- 5.4% in their 80s
Diversity
- 90.9% White
- 0.5% Black
- 0.8% Native
- 1.6% Identifying as Other
- 6.2% Mixed Race
- 4.4% Hispanic


