Best Assisted Living Facilities in Marion, IN
Find local assisted living and retirement communities in the Marion, IN area.
In Marion, Indiana, seniors account for an estimated 37.8% of the population, showcasing the city's need for comprehensive senior living options. With four facilities located within the city and an equal number in the surrounding area, Marion offers a range of choices from independent living to specialized memory care. The average cost of assisted living here is a budget-friendly $3,352 per month, making it an attractive option for affordability and quality care. This guide aims to explore the top senior living options in Marion, helping you find a community that fits the needs of you or your loved one, ensuring comfort and quality in their golden years.
- Adult Day Services
- Assisted Living
- Home Care
- Independent Living
- Memory Care
- Nursing Home
- Residential Care Home
- Senior Apartments
- Distance from City Center
- Highest Rating
- Name: A - Z
- Name: Z - A

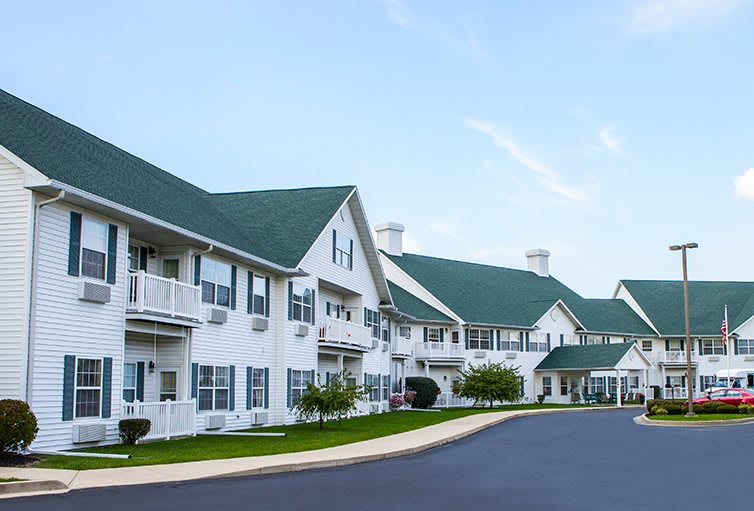
Aperion Care Marion
614 W 14th St, Marion, IN 46953 (0.4 mi from city center)Aperion Care Marion is a senior living community offering assisted living, skilled nursing care, and short-term rehabilitation.

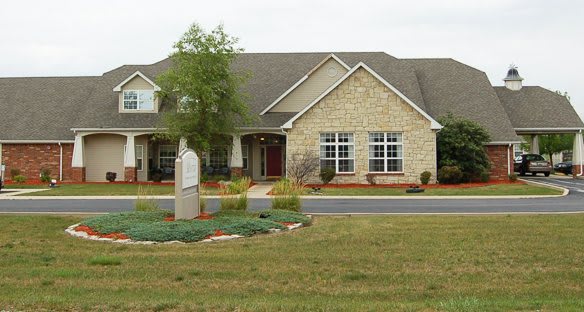
Northwood Manor
1590 W Timberview Dr, Marion, IN 46952 (2.3 mi from city center)Northwood Manor is an independent living community located in Marion, IN, offering a stress-free and engaging lifestyle with various activities and amenities.

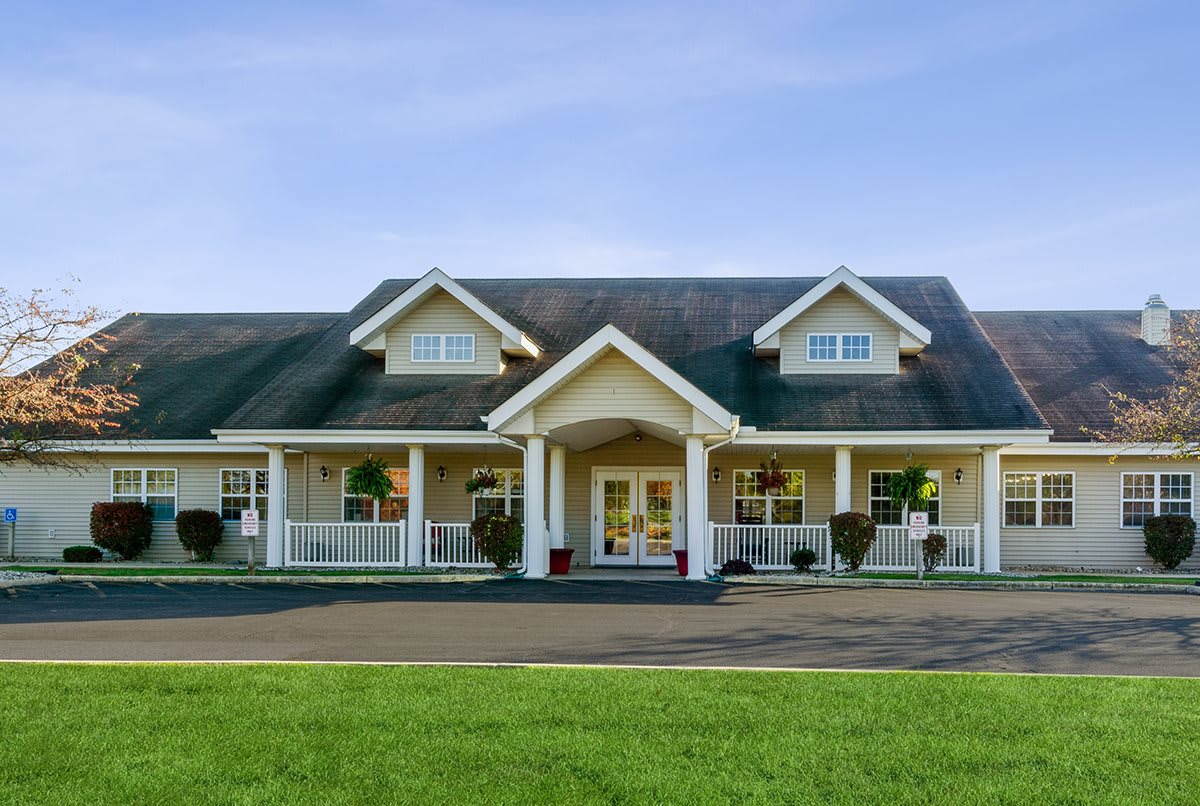
Wyndmoor of Marion
2452 West Kem Rd, Marion, IN 46952 (2.5 mi from city center)Wyndmoor of Marion is an Assisted Living community located at 2452 West Kem Road in Marion, IN, offering a wide array of medical and wellness services, including 12-16 hour nursing care, a 24-hour call system, and round-the-clock supervision.

Cedar Creek of Marion
725 W. 50th Street, Marion, IN 46953 (2.9 mi from city center)Cedar Creek of Marion is an assisted living senior living community offering a full range of social events and activities, plus additional support of individual care plans developed by qualified staff and a full-time registered nurse.
Map of Assisted Living in Marion
Find the right senior living community by location- Aperion Care Marion
- Northwood Manor
- Wyndmoor of Marion
- Cedar Creek of Marion
Senior Living Statistics for Marion, Indiana
Average Senior Living Costs by Housing Type
In Marion, Indiana, independent living is the most affordable senior housing option, averaging $3,151 per month. Assisted living is another cost-effective choice at $3,352 monthly. For those requiring specialized support, memory care averages $4,769 per month. Nursing home accommodations include a private room for $3,550, while a semi-private room is priced at $3,225, making these options attractively priced. Marion provides a range of affordable choices, allowing seniors to select accommodations that best meet their needs and budget.
| Housing Type | Average Monthly Cost |
|---|---|
| Assisted Living | $3,352 |
| Memory Care | $4,769 |
| Independent Living | $3,151 |
| Nursing Home: Private Room | $3,550 |
| Nursing Home: Semi-Private Room | $3,225 |
Average Cost of Assisted Living in Marion
The average monthly cost of assisted living facilities in Marion is $3,352. Nearby cities like Van Buren and Mount Etna are slightly less expensive, with average costs of $3,221 per month and $3,214 per month, respectively. Marion's assisted living costs are notably lower than both the Indiana state average of $3,843 and the national average of $4,546.
| City | Average Monthly Cost |
|---|---|
| Marion | $3,352 |
| Van Buren | $3,221 |
| Mount Etna | $3,214 |
Here is how the average cost of assisted living in Marion compares to Indiana and the national average:
| Area | Average Monthly Cost |
|---|---|
| Marion | $3,352 |
| Indiana | $3,843 |
| United States | $4,546 |
Senior Living Availability in Marion
Marion, Indiana, residents have 4 senior living facilities to choose from. In the surrounding area, there are also 4 communities, and the state offers a total of 487 facilities.
Marion
Surrounding Area
Indiana
Marion Senior Demographics
In Marion, Indiana, seniors make up about 37.8% of the city's 27,528 residents. These older adults are spread across age groups, with 12.8% in their 50s, 12.1% in their 60s, 7.7% in their 70s, and 5.2% in their 80s and over. The gender distribution leans towards females, who make up 54.5% of the population compared to 45.5% males. Marital status shows a mixed community, with 30.2% married, a significant 20.4% divorced, 41.5% never married, and 7.9% widowed. Marion presents a diverse community, with 76.7% White, 14% Black, and smaller percentages of 1% Asian and 6.8% Hispanic, alongside 6.2% identifying as mixed race, enriching the community's cultural experience.
Population
Marion has a population of 27,528.- 45.5% Male
- 54.5% Female
Marital Status
- 30.2% Married
- 20.4% Divorced
- 41.5% Never Married
- 7.9% Widowed
Age
Seniors make up about 37.8% of the population.- 12.8% in their 50s
- 12.1% in their 60s
- 7.7% in their 70s
- 5.2% in their 80s
Diversity
- 76.7% White
- 14% Black
- 1% Asian
- 0.3% Native
- 1.8% Identifying as Other
- 6.2% Mixed Race
- 6.8% Hispanic
