Best Assisted Living Facilities in Chanute, KS
Find local assisted living and retirement communities in the Chanute, KS area.
Chanute is home to 4 senior living facilities, with options ranging from independent living to memory care. Since 37.2% of the city's population are seniors, there is a significant need for quality care, and we understand just how important it is to find the right fit for your needs. In this article, we will cover the best senior living facilities in Chanute so you can find the right place for your loved one to enjoy their golden years.
- Adult Day Services
- Assisted Living
- Home Care
- Independent Living
- Memory Care
- Nursing Home
- Residential Care Home
- Respite Care
- Senior Apartments
- Distance from City Center
- Highest Rating
- Name: A - Z
- Name: Z - A
Murray Hill Senior
400 W 3rd St, Chanute, KS 66720 (0.6 mi from city center)Murray Hill Senior offers exclusive senior living for residents 55 and above, with one and two-bedroom private apartments featuring open concept layouts, individual temperature controls, and bathrooms with safety bars.

Heritage Health Care
1630 W 2nd St, Chanute, KS 66720 (1 mi from city center)Heritage Health Care offers skilled nursing care with a focus on making residents feel welcomed and engaged.
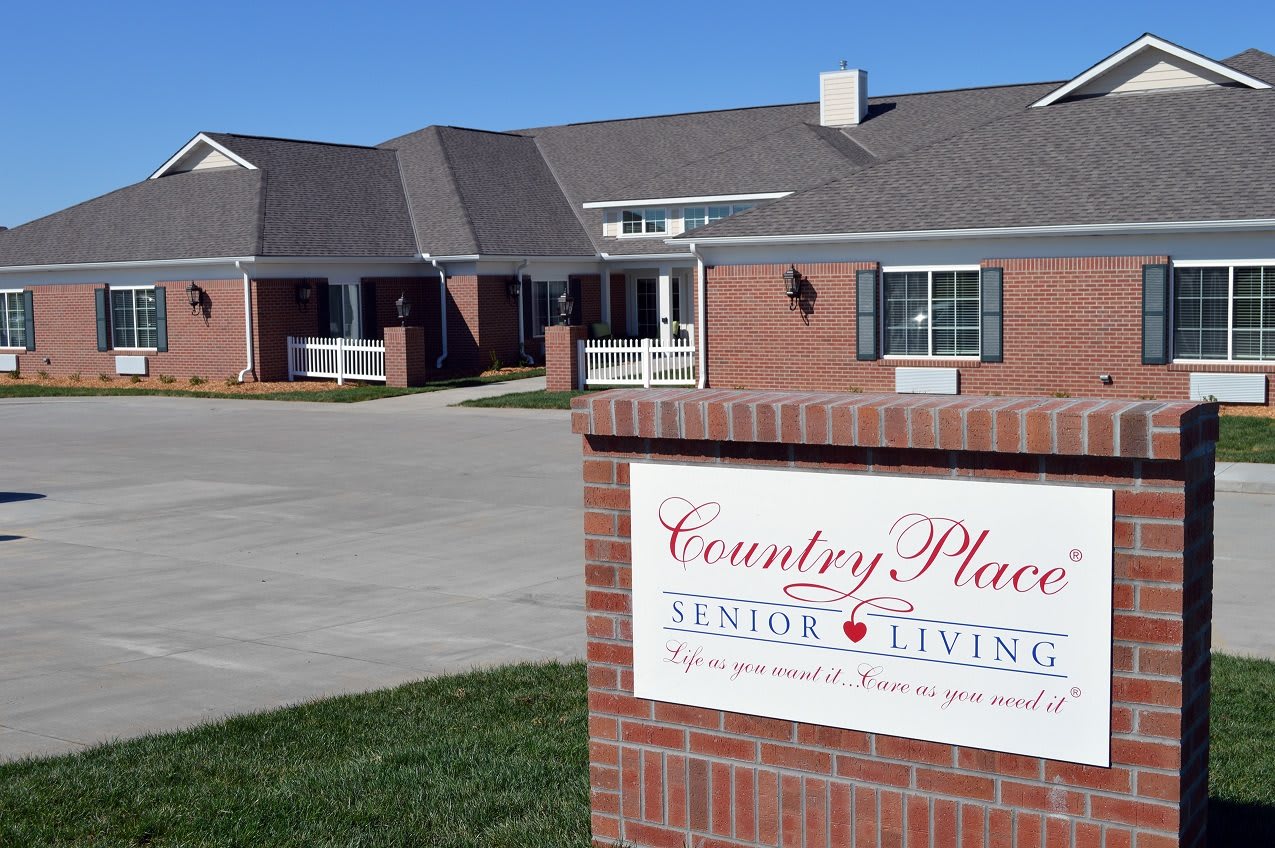
Credo Senior Living
701 Osa Martin Blvd, Chanute, KS 66720 (2 mi from city center)Credo Senior Living offers assisted living in a thoughtfully designed environment that encourages independence.
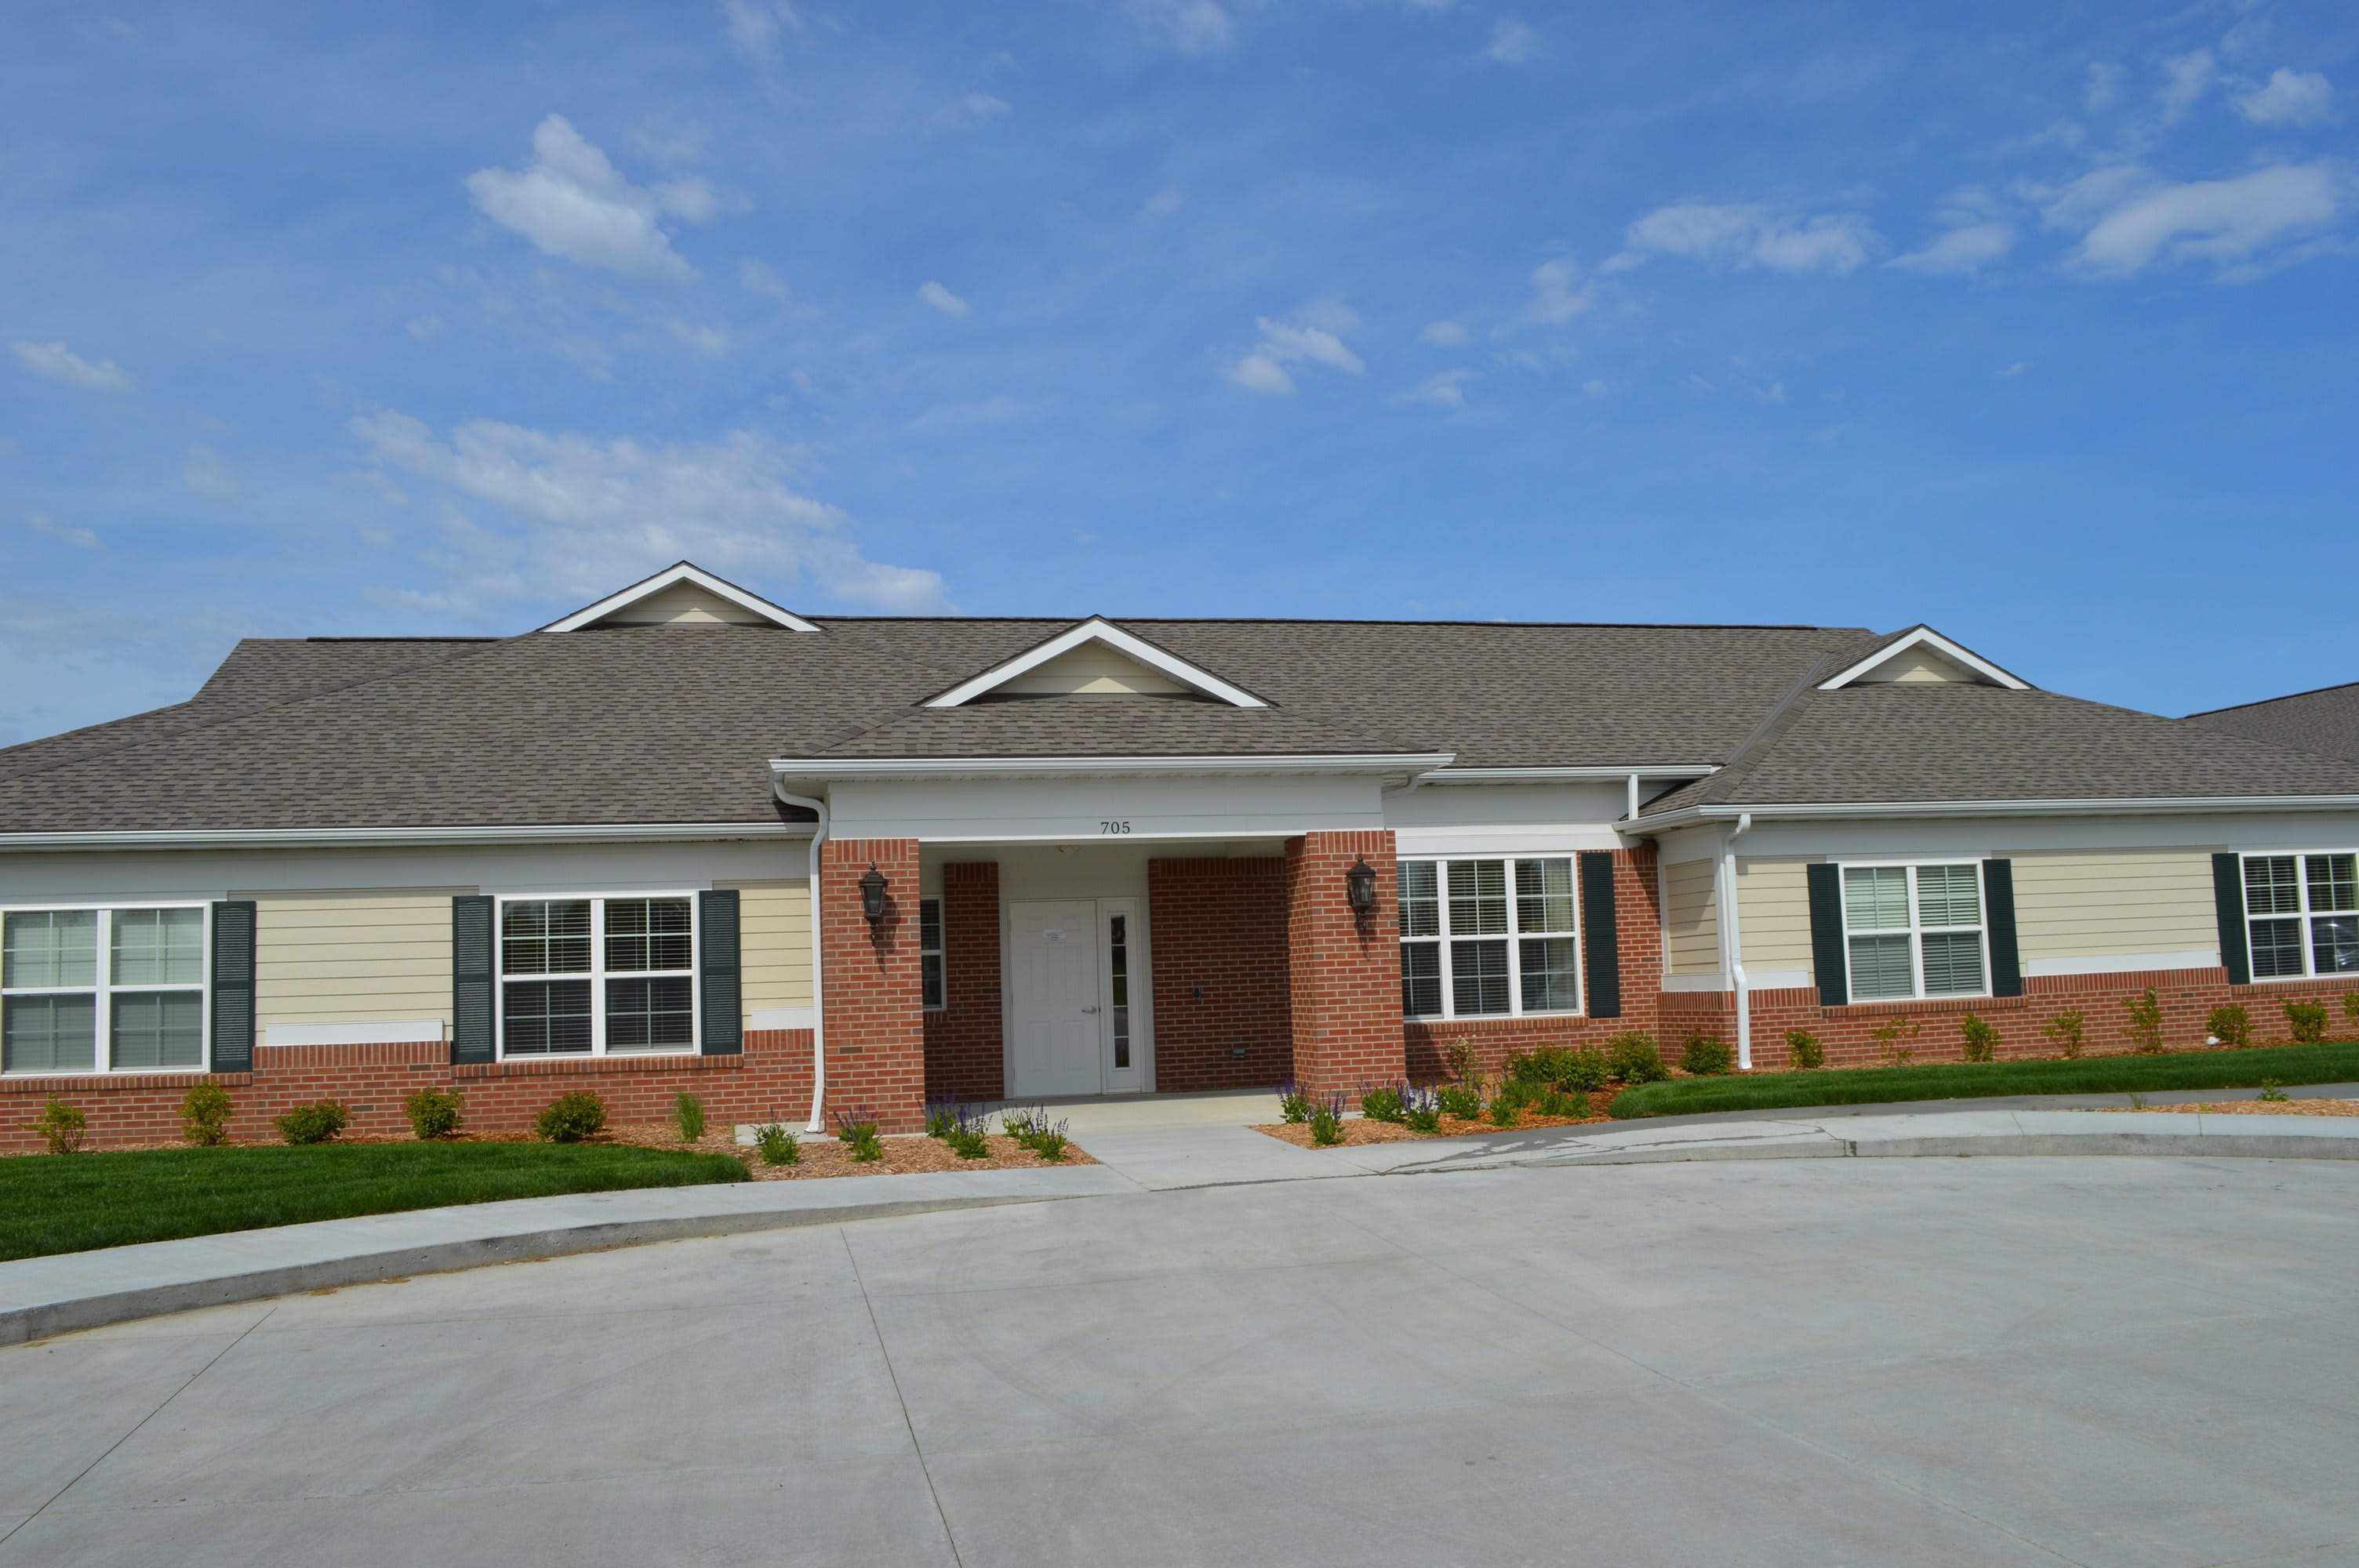
Credo Memory Care
705 Osa Martin Blvd, Chanute, KS 66720 (2 mi from city center)Credo Memory Care is a senior living facility offering memory care services in Chanute, Kansas.
Map of Assisted Living in Chanute
Find the right senior living community by location- Murray Hill Senior
- Heritage Health Care
- Credo Senior Living
- Credo Memory Care
Senior Living Statistics for Chanute, Kansas
Average Senior Living Costs by Housing Type
Chanute, Kansas offers several types of senior living at various price points. The least expensive option, independent living, averages $2,974 per month, while assisted living is slightly higher at $3,701. Memory care offers a specialized option at $3,869 per month.
| Housing Type | Average Monthly Cost |
|---|---|
| Assisted Living | $3,701 |
| Memory Care | $3,869 |
| Independent Living | $2,974 |
Average Cost of Assisted Living in Chanute
Compared to other cities in the area, Chanute is slightly more affordable. For instance, Coyville assisted living costs an average of $3,553 per month, and Benedict costs an average of $3,484 per month. On the flip side, Chanute is less expensive than the state average in Kansas ($4,947) and the national average of $4,546 per month.
| City | Average Monthly Cost |
|---|---|
| Chanute | $3,701 |
| Coyville | $3,553 |
| Benedict | $3,484 |
Here is how the average cost of assisted living in Chanute compares to Kansas and the national average:
| Area | Average Monthly Cost |
|---|---|
| Chanute | $3,701 |
| Kansas | $4,947 |
| United States | $4,546 |
Senior Living Availability in Chanute
Curious about senior living possibilities in and around Chanute? The city boasts 4 communities, and although there are 0 in the surrounding area, the state of Kansas features 291.
Chanute
Surrounding Area
Kansas
Chanute Senior Demographics
Seniors make up 37.2% of the population in Chanute. The age distribution includes 12% in their 50s, 14% in their 60s, 6.8% in their 70s, and 4.4% in their 80s and over. Gender-wise, the population is 47.4% male and 52.6% female. Regarding marital status, 40.9% are married, 20.2% are divorced, 32% have never married, and 6.9% are widowed. The diversity profile includes 93.1% White and 5.1% mixed race, with 7.5% Hispanic residents enriching the community's cultural fabric.
Population
Chanute has a population of 8,629.- 47.4% Male
- 52.6% Female
Marital Status
- 40.9% Married
- 20.2% Divorced
- 32% Never Married
- 6.9% Widowed
Age
Seniors make up about 37.2% of the population.- 12% in their 50s
- 14% in their 60s
- 6.8% in their 70s
- 4.4% in their 80s
Diversity
- 93.1% White
- 1.3% Black
- 0.2% Asian
- 0.4% Identifying as Other
- 5.1% Mixed Race
- 7.5% Hispanic
Senior Living Ratings Methodology
Our experts spent over 50 hours researching the best communities in each city, focusing on these key factors.

Available Care
We value communities that offer more than standard living services, such as memory care and independent living. We think this is beneficial for older adults, as it allows a community to meet your changing needs over time.
Amenities
Amenities can help an assisted living community feel like a luxury resort or a home away from home. Our research focuses on communities that offer extra perks and benefits for seniors to enjoy.
Location
Location can be important. Since many seniors like to have certain comforts nearby, we look at communities close to parks, shopping areas, hospitals, museums, and other practical or entertaining points of interest.
Reviews
We read through dozens of reviews for every single contender and include a summary of our findings. In most cases, we see common themes regarding positive and negative feedback about each community. Just remember not to take individual reviews at face value.
Cost
Assisted living costs vary greatly based on the facility and level of care. We considered communities that are suitable for various budgets and offer solid value. All prices listed are from community websites.