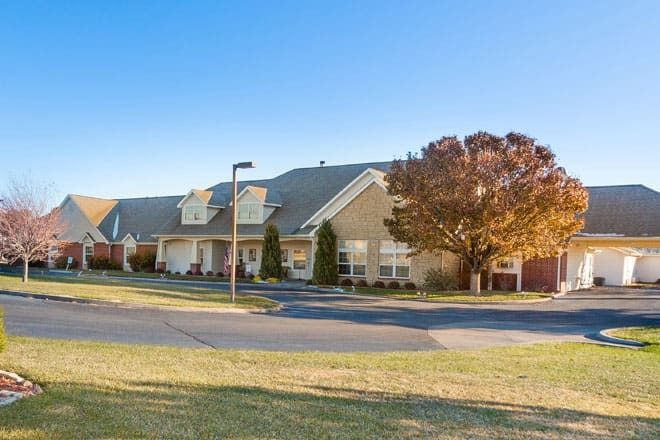
Best Assisted Living Facilities in Dodge City, KS
Find local assisted living and retirement communities in the Dodge City, KS area.
Are you looking for senior living in the Dodge City area? With a variety of options available, from assisted living to nursing homes, you're sure to find something that fits your needs. The average cost of assisted living in the area is $5,739 per month, though costs range depending on the facility, location, and level of care you need. Below, we will take a look at some of the top assisted living options in Dodge City so you can find the best care for your loved one.
- Adult Day Services
- Assisted Living
- Home Care
- Independent Living
- Memory Care
- Nursing Home
- Residential Care Home
- Respite Care
- Senior Apartments
- Distance from City Center
- Highest Rating
- Name: A - Z
- Name: Z - A

Manor of the Plains
200 Campus Dr, Dodge City, KS 67801 (1.1 mi from city center)Manor of the Plains is a faith-based, not-for-profit senior living community offering independent living, assisted living, and long-term care in Dodge City, Kansas.

Brookdale Dodge City
2400 North 14th Avenue, Dodge City, KS 67801 (1.3 mi from city center)Brookdale Dodge City offers assisted living residents with lifestyles, housing, and services in comfortable surroundings combined with exceptional amenities, programs, and care.

Hill Top House
505 W Elm St, Bucklin, KS 67834 (25.4 mi from city center)Hill Top House is a not-for-profit 32 bed skilled nursing facility and 7 bed assisted living facility owned and operated by the Bucklin Hosp. District.
Map of Assisted Living in Dodge City
Find the right senior living community by location- Manor of the Plains
- Brookdale Dodge City
- Hill Top House
Senior Living Statistics for Dodge City, Kansas
Average Senior Living Costs by Housing Type
Assisted living in Dodge City, Kansas costs $5,739 per month. The most costly type of living is a private room in a nursing home, averaging $6,343. Other options include memory care at $5,739 per month and independent living at $3,965.
| Housing Type | Average Monthly Cost |
|---|---|
| Assisted Living | $5,739 |
| Memory Care | $5,739 |
| Independent Living | $3,965 |
| Nursing Home: Private Room | $6,343 |
| Nursing Home: Semi-Private Room | $5,229 |
Average Cost of Assisted Living in Dodge City
Compared to other cities in the area, Dodge City is slightly more expensive. For instance, Jetmore assisted living costs an average of $4,229 per month, and Hanston assisted living costs the same. On the flip side, Dodge City exceeds both the Kansas state average of $4,947 and the national average of $4,546 per month.
| City | Average Monthly Cost |
|---|---|
| Dodge City | $5,739 |
| Jetmore | $4,229 |
| Hanston | $4,229 |
Here is how the average cost of assisted living in Dodge City compares to Kansas and the national average:
| Area | Average Monthly Cost |
|---|---|
| Dodge City | $5,739 |
| Kansas | $4,947 |
| United States | $4,546 |
Senior Living Availability in Dodge City
There are many choices for senior living in Kansas. The state is home to 291 facilities, while Dodge City has 2 communities, and the area surrounding Dodge City has 3 options.
Dodge City
Surrounding Area
Kansas
Dodge City Senior Demographics
Residents of Dodge City who are seniors make up 24.2% of the community, forming a significant portion of the local demographic. Of the citizens, 10% are in their 50s, 8.2% are in their 60s, 4% in their 70s, and 2% are 80 and older. The city is a tapestry of cultures, with 66.4% being Hispanic and other ethnicities comprising 50.4% White, 24% mixed race, 2.8% Black, 1.2% Native American, 0.9% Asian, and 20.4% identifying as other. Marital status across the adult population shows 44.5% are married, 14.8% are divorced, 35.2% never married, and 5.4% widowed.
Population
Dodge City has a population of 27,652.- 51.9% Male
- 48.1% Female
Marital Status
- 44.5% Married
- 14.8% Divorced
- 35.2% Never Married
- 5.4% Widowed
Age
Seniors make up about 24.2% of the population.- 10% in their 50s
- 8.2% in their 60s
- 4% in their 70s
- 2% in their 80s
Diversity
- 50.4% White
- 2.8% Black
- 0.9% Asian
- 1.2% Native
- 0.3% Pacific
- 20.4% Identifying as Other
- 24% Mixed Race
- 66.4% Hispanic
