Best Assisted Living Facilities in Fort Scott, KS
Find local assisted living and retirement communities in the Fort Scott, KS area.
Fort Scott has many senior living options, catering to diverse needs and preferences. With a senior population that makes up about 38.2% of the city, there is a high demand for quality assisted living facilities. In Fort Scott, assisted living costs average $4,014 per month, with options ranging from independent living to memory care. In this article, we will cover the best senior living options in the city, highlighting the facilities that stand out for their services, amenities, and overall value.
- Adult Day Services
- Assisted Living
- Home Care
- Independent Living
- Memory Care
- Nursing Home
- Residential Care Home
- Respite Care
- Senior Apartments
- Distance from City Center
- Highest Rating
- Name: A - Z
- Name: Z - A

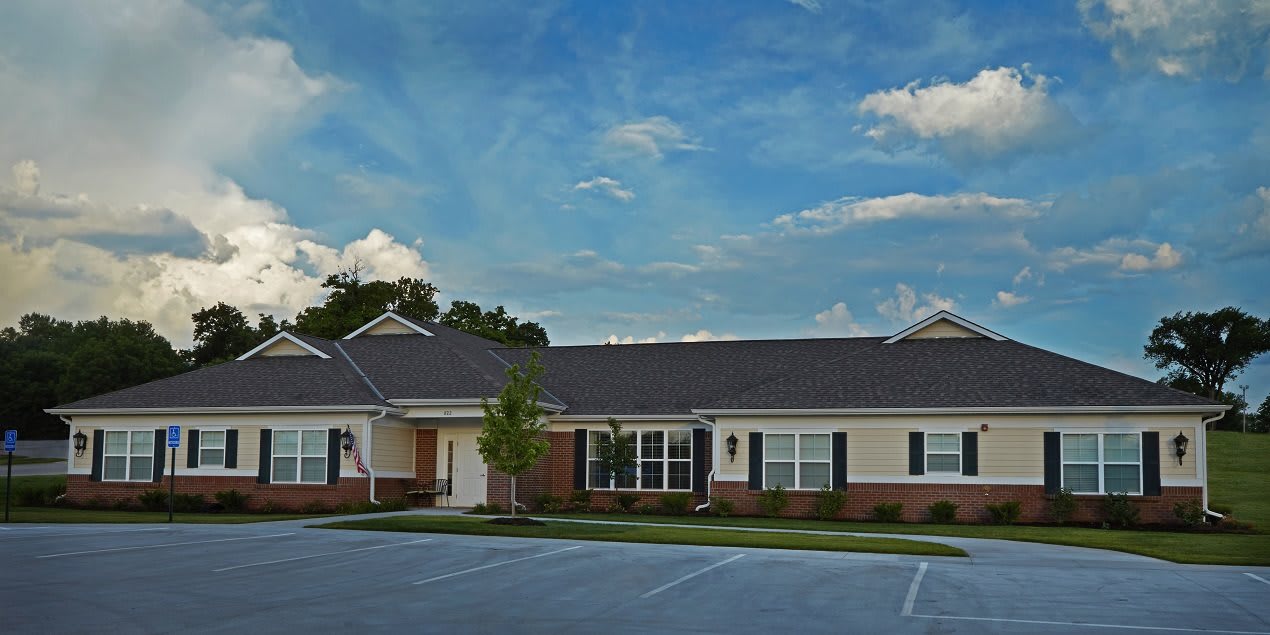
Credo Senior Living
822 S Horton St, Fort Scott, KS 66701 (0.6 mi from city center)Credo Senior Living offers seniors a spectrum of care including Independent Living, three levels of Assisted Living, and Memory Care.

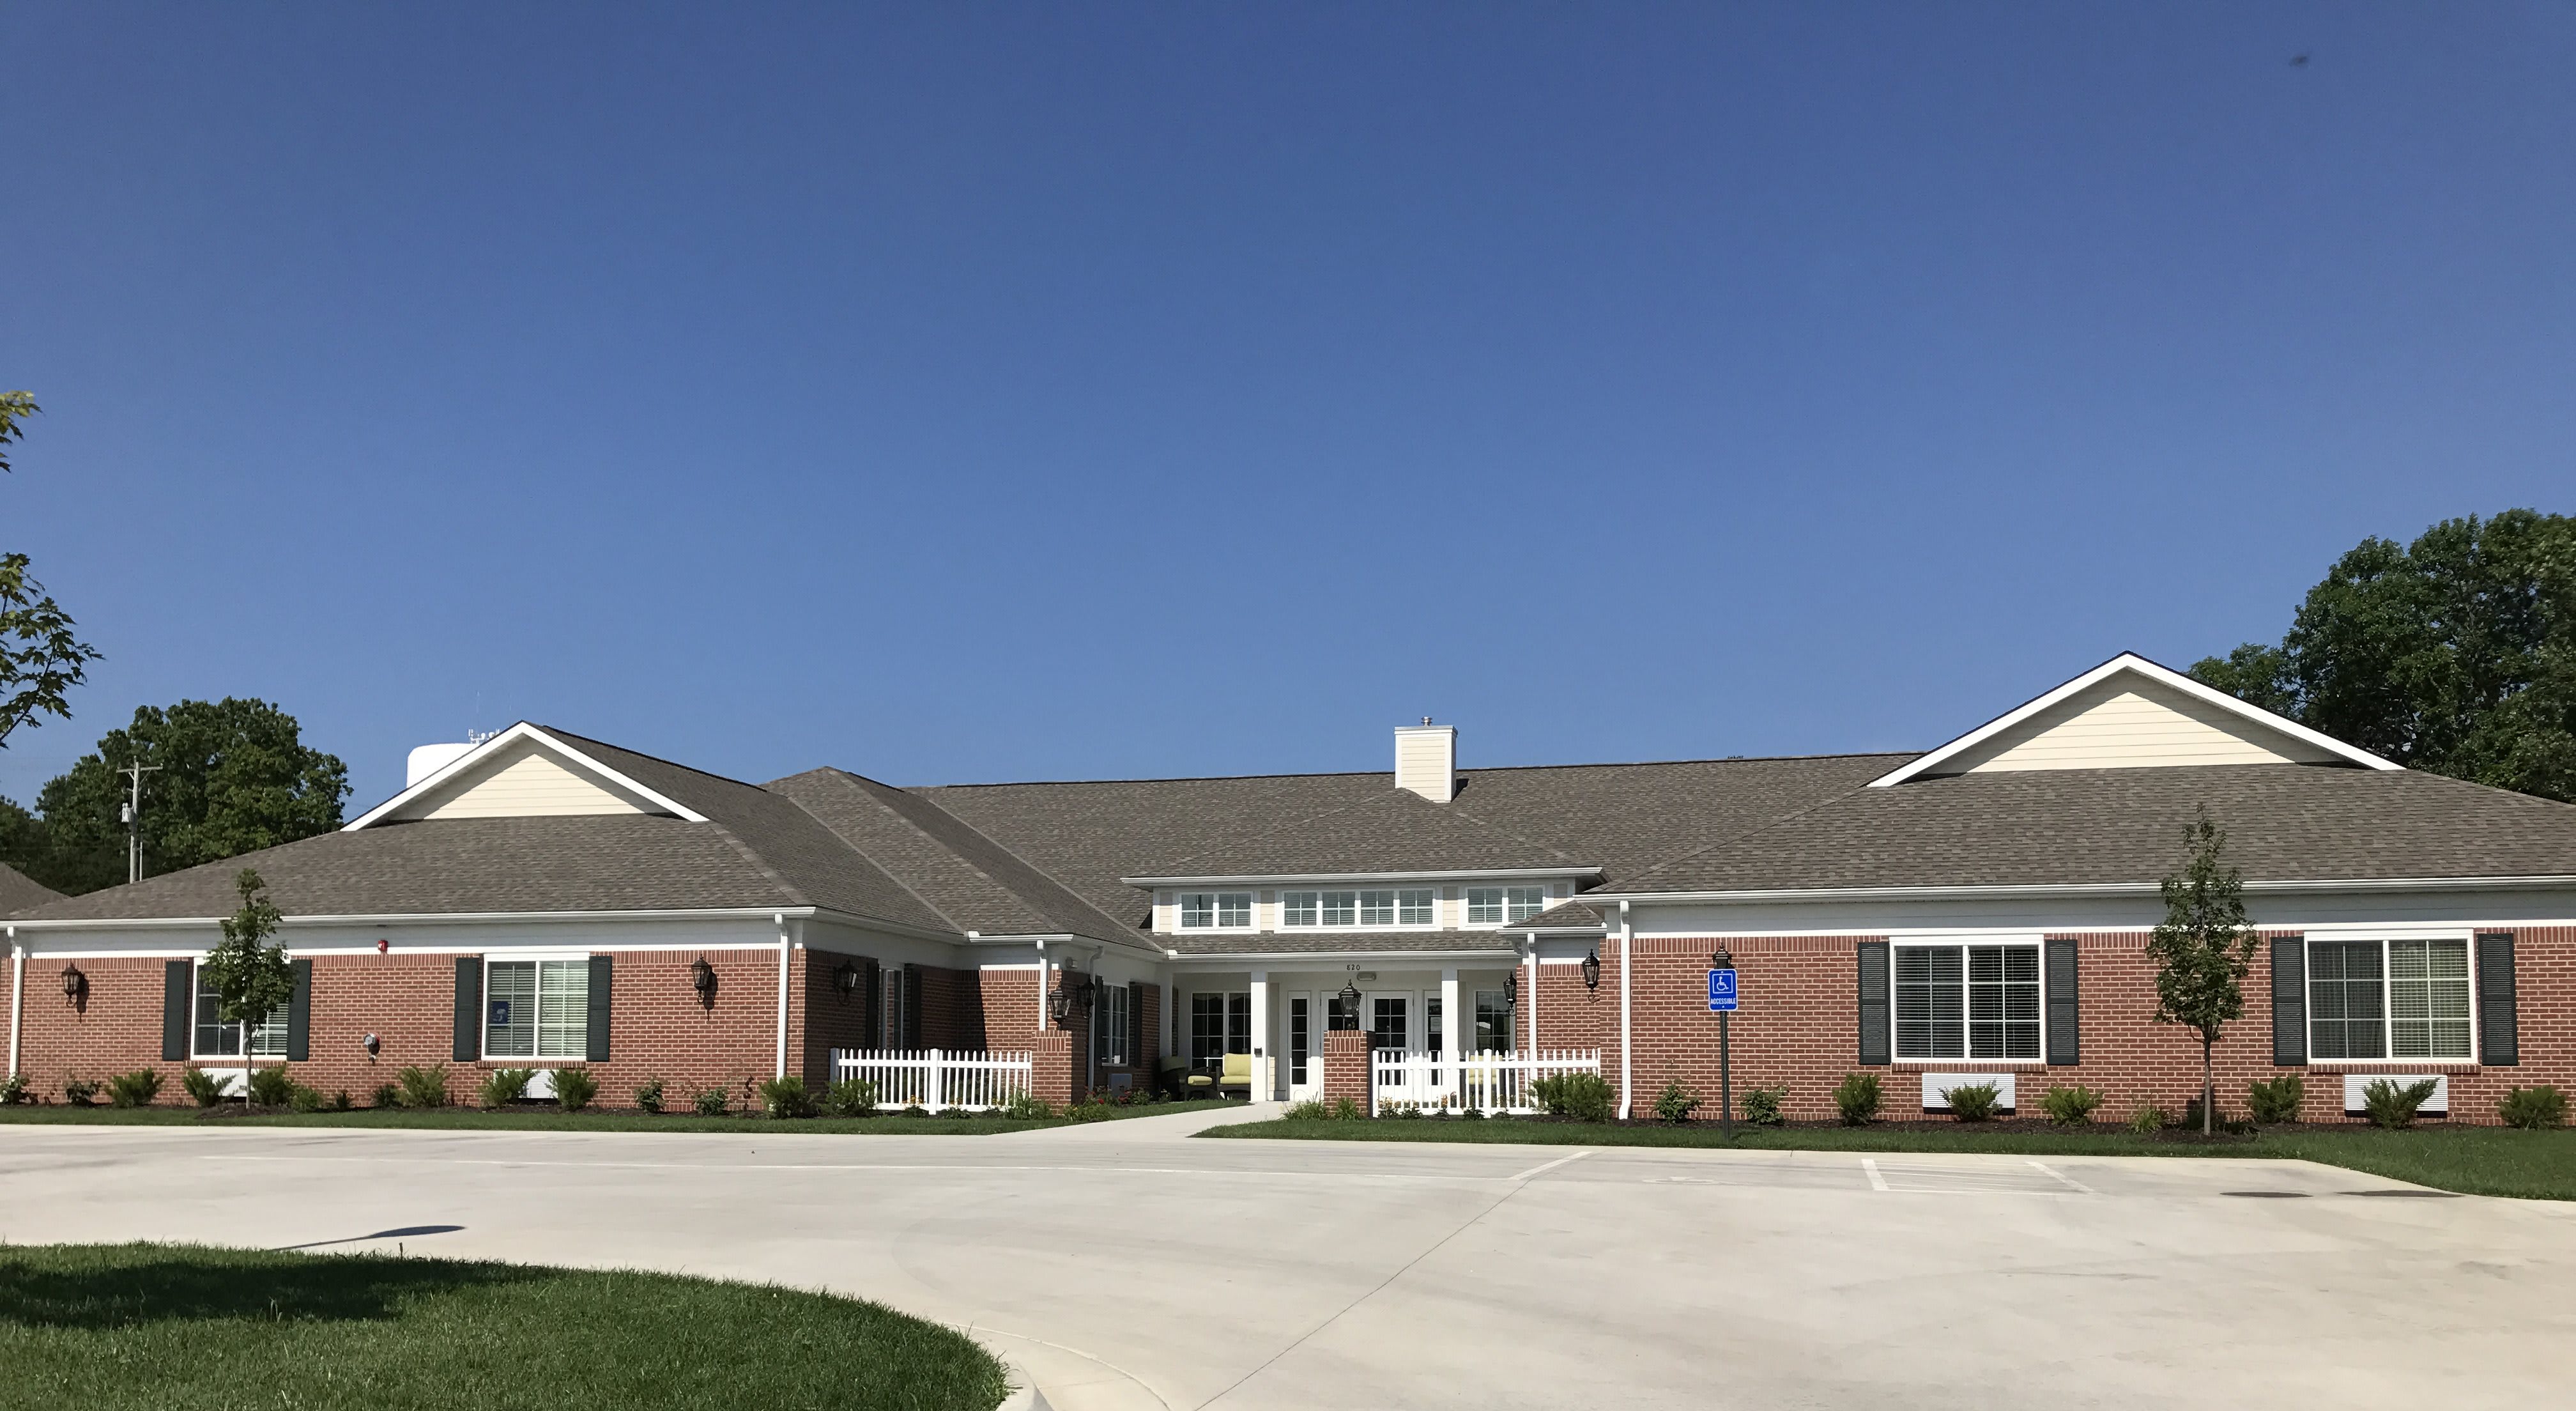
Country Place Senior Living
820 S Horton St, Fort Scott, KS 66701 (0.6 mi from city center)Credo Senior Living offers seniors a spectrum of care including Independent Living, three levels of Assisted Living, and Memory Care.

Guest Home Estates VI
737 Heylman St, Fort Scott, KS 66701 (0.8 mi from city center)Guest Home Estates VI is a medium-sized assisted living community in Fort Scott, Kansas, offering 24-hour care and medical services, with a focus on resident health, well-being, and happiness.

Fort Scott Presbyterian Village
2401 Horton St, Fort Scott, KS 66701 (1.2 mi from city center)Fort Scott Presbyterian Village is a faith-based, not-for-profit senior living community offering assisted living services.
Map of Assisted Living in Fort Scott
Find the right senior living community by location- Credo Senior Living
- Country Place Senior Living
- Guest Home Estates VI
- Fort Scott Presbyterian Village
Senior Living Statistics for Fort Scott, Kansas
Average Senior Living Costs by Housing Type
Senior housing costs in Fort Scott, Kansas start at an average of $2,549 per month for a semi-private room in a nursing home. Prices can range up to $4,500 per month for a studio unit in a nursing home. There are plenty of options at price points in between, including independent living at $3,637 per month, memory care at $4,014 per month, and assisted living at the same cost of $4,014 per month.
| Housing Type | Average Monthly Cost |
|---|---|
| Assisted Living | $4,014 |
| Memory Care | $4,014 |
| Independent Living | $3,637 |
| Nursing Home: Private Room | $2,915 |
| Nursing Home: Semi-Private Room | $2,549 |
| Nursing Home: Studio | $4,500 |
Average Cost of Assisted Living in Fort Scott
When compared to nearby cities, Fort Scott senior living is slightly more expensive. The average monthly cost of assisted living is 4014 in Fort Scott, $3,019 in Pittsburg, and $3,137 in Cherokee. Additionally, Fort Scott is below the state average in Kansas ($4,947), as well as the national average ($4,546).
| City | Average Monthly Cost |
|---|---|
| Fort Scott | $4,014 |
| Pittsburg | $3,019 |
| Cherokee | $3,137 |
Here is how the average cost of assisted living in Fort Scott compares to Kansas and the national average:
| Area | Average Monthly Cost |
|---|---|
| Fort Scott | $4,014 |
| Kansas | $4,947 |
| United States | $4,546 |
Senior Living Availability in Fort Scott
Fort Scott residents have 4 senior living facilities to choose from. The surrounding area offers 0 communities, and the state offers a total of 291 facilities in Kansas.
Fort Scott
Surrounding Area
Kansas
Fort Scott Senior Demographics
Residents of Fort Scott include 45.5% male and 54.5% female. Seniors make up 38.2% of the population, with 8.6% in their 50s, 14.4% in their 60s, 9.9% in their 70s, and 5.3% over 80. Among adults, 49.4% are married, 13.2% divorced, 27.5% never married, and 9.9% widowed. The demographic includes 90.5% White, 2.9% Black, 0.1% Asian, with 6.3% identifying as mixed race, and 3% Hispanic.
Population
Fort Scott has a population of 7,551.- 45.5% Male
- 54.5% Female
Marital Status
- 49.4% Married
- 13.2% Divorced
- 27.5% Never Married
- 9.9% Widowed
Age
Seniors make up about 38.2% of the population.- 8.6% in their 50s
- 14.4% in their 60s
- 9.9% in their 70s
- 5.3% in their 80s
Diversity
- 90.5% White
- 2.9% Black
- 0.1% Asian
- 0.2% Identifying as Other
- 6.3% Mixed Race
- 3% Hispanic
