Best Assisted Living Facilities in Garden City, KS
Find local assisted living and retirement communities in the Garden City, KS area.
If you are looking for senior living in Garden City, there are a few communities to consider. The city's 3 senior living facilities include independent living, assisted living, memory care, and nursing homes. The cost for assisted living in Garden City is $4,836 per month on average, but prices will vary significantly depending on the type of care you need. Around 29.5% of the city's residents are seniors, so there is substantial demand for quality senior living and care. Keep reading to learn about the best senior living in Garden City. We'll highlight communities known for excellent services, amenities, and value.
- Adult Day Services
- Assisted Living
- Home Care
- Independent Living
- Memory Care
- Nursing Home
- Residential Care Home
- Respite Care
- Senior Apartments
- Distance from City Center
- Highest Rating
- Name: A - Z
- Name: Z - A

Garden Valley Retirement Inc
1505 E Spruce St, Garden City, KS 67846 (0.5 mi from city center)Garden Valley Retirement Village offers independent living, skilled nursing, respite, and extended care in a community with kind staff.

Homestead of Garden City
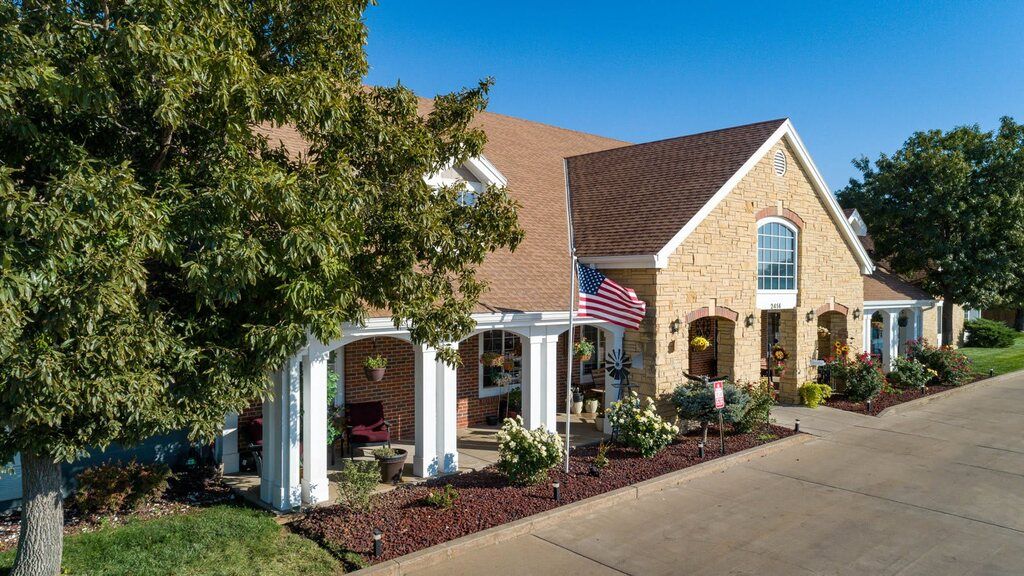
2414 Henderson Dr, Garden City, KS 67846 (0.9 mi from city center)Homestead of Garden City is an assisted living facility offering studio and one-bedroom options.

Ranch House Assisted Living
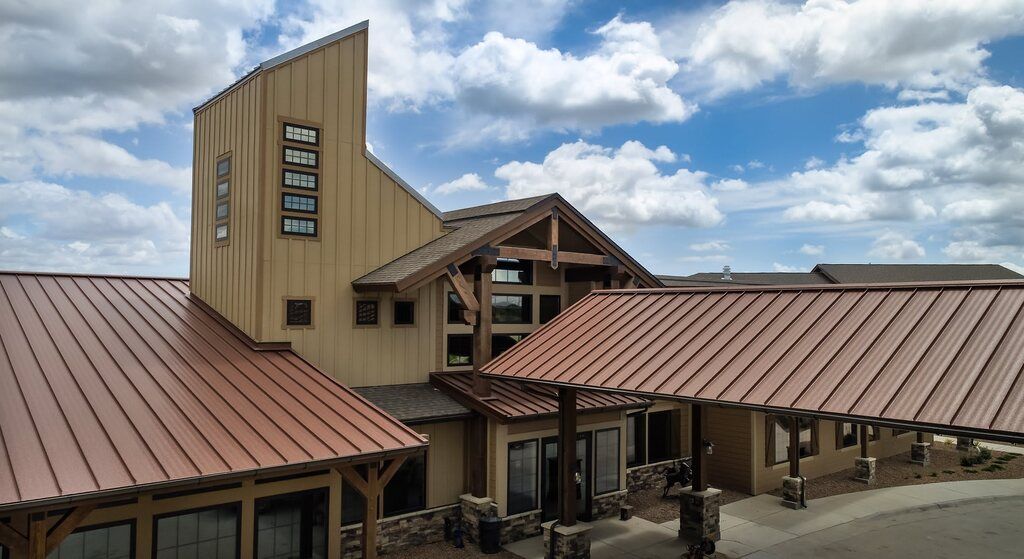
2900 Campus Dr, Garden City, KS 67846 (1.4 mi from city center)The Ranch House is a senior living community that offers residents high quality assisted living, rapid recovery, and skilled nursing care in Garden City, Kansas.
Map of Assisted Living in Garden City
Find the right senior living community by location- Garden Valley Retirement Inc
- Homestead of Garden City
- Ranch House Assisted Living
Senior Living Statistics for Garden City, Kansas
Average Senior Living Costs by Housing Type
The least expensive type of senior living in Garden City, Kansas is independent living, which costs $4,737 per month on average, while the most expensive option is a private room in a nursing home at $5,840 per month. There are various other types of care at different price points, including assisted living and memory care, both at $4,836, and a semi-private nursing home room at $4,912.
| Housing Type | Average Monthly Cost |
|---|---|
| Assisted Living | $4,836 |
| Memory Care | $4,836 |
| Independent Living | $4,737 |
| Nursing Home: Private Room | $5,840 |
| Nursing Home: Semi-Private Room | $4,912 |
Average Cost of Assisted Living in Garden City
Assisted living facilities in Garden City cost an average of 4836 per month, which is slightly less expensive than the Kansas state average of $4,947 per month but above the nationwide average of $4,546 per month. On the other hand, Garden City assisted living is more expensive than nearby cities, such as Moscow and Peterson.
| City | Average Monthly Cost |
|---|---|
| Garden City | $4,836 |
| Moscow | $3,780 |
| Peterson | $4,349 |
Here is how the average cost of assisted living in Garden City compares to Kansas and the national average:
| Area | Average Monthly Cost |
|---|---|
| Garden City | $4,836 |
| Kansas | $4,947 |
| United States | $4,546 |
Senior Living Availability in Garden City
If you don't find the senior living option that's right for you in Garden City, there are still choices available. There are 3 facilities in the surrounding area, while the entire state of Kansas offers a total of 291 facilities.
Garden City
Surrounding Area
Kansas
Garden City Senior Demographics
In Garden City, 51.7% of the population is male, and 48.3% is female. Seniors account for 29.5%, with 11.8% in their 50s, 9.1% in their 60s, 5.4% in their 70s, and 3.2% over 80. The city's diversity includes 50.6% White, 5.9% Black, 4.4% Asian, and 54.6% Hispanic. Marital status shows 47% married, 12.9% divorced, 35.4% never married, and 4.7% widowed.
Population
Garden City has a population of 27,781.- 51.7% Male
- 48.3% Female
Marital Status
- 47% Married
- 12.9% Divorced
- 35.4% Never Married
- 4.7% Widowed
Age
Seniors make up about 29.5% of the population.- 11.8% in their 50s
- 9.1% in their 60s
- 5.4% in their 70s
- 3.2% in their 80s
Diversity
- 50.6% White
- 5.9% Black
- 4.4% Asian
- 0.4% Native
- 0.2% Pacific
- 16.6% Identifying as Other
- 21.9% Mixed Race
- 54.6% Hispanic
