Best Assisted Living Facilities in Ottawa, KS
Find local assisted living and retirement communities in the Ottawa, KS area.
Ottawa has a diverse selection of senior living facilities (3 to be exact), including independent living, assisted living, and memory care. The city's average cost of assisted living is $4,814 per month, which is slightly higher than the nationwide average of $4,546 per month. Since seniors make up 34.7% of the Ottawa population, there is a high demand for quality care. In this article, we'll discuss the best senior living options in Ottawa that rank well for their services, amenities, and care.
- Adult Day Services
- Assisted Living
- Home Care
- Independent Living
- Memory Care
- Nursing Home
- Residential Care Home
- Respite Care
- Senior Apartments
- Distance from City Center
- Highest Rating
- Name: A - Z
- Name: Z - A

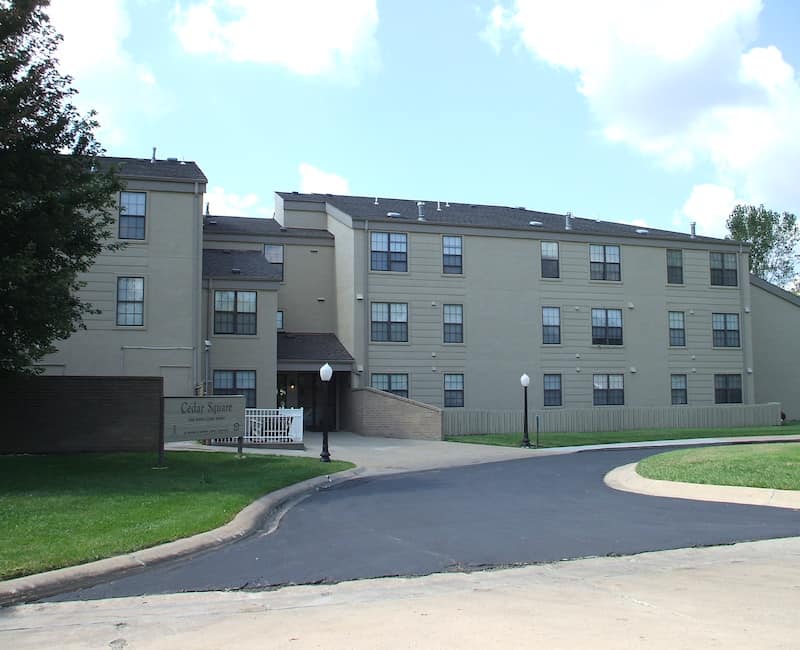
Cedar Square
1550 South Cedar, Ottawa, KS 66067 (0.5 mi from city center)Cedar Square offers an affordable rental community for seniors age 62+ with handicap accessible studio and one-bedroom floor plans.

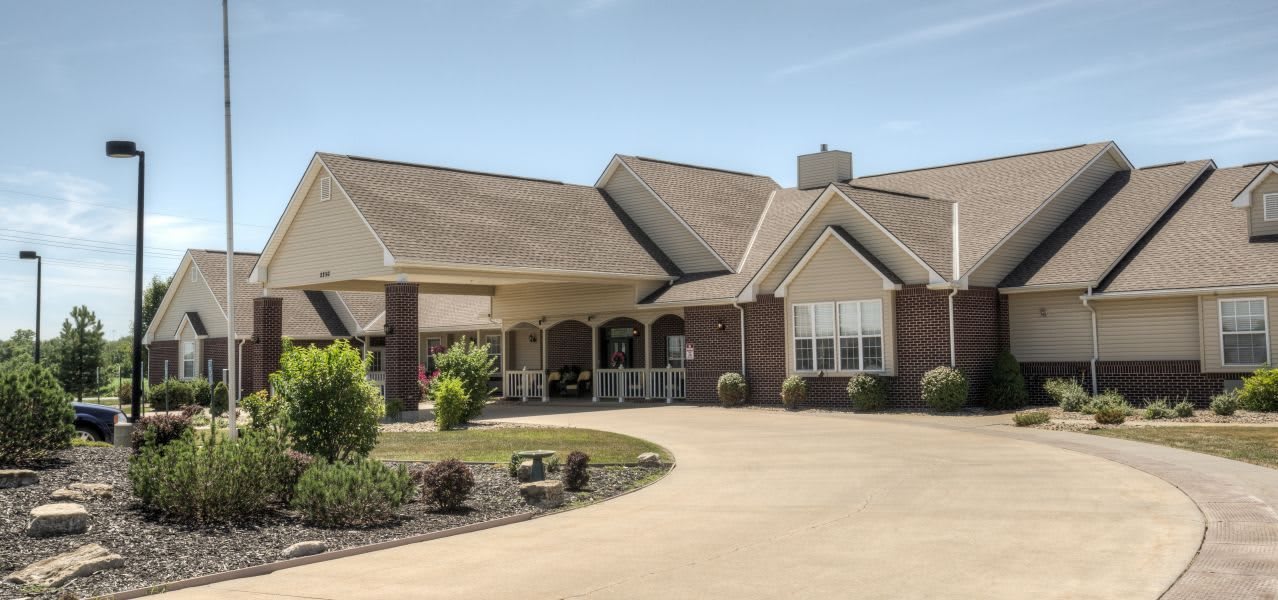
Rock Creek of Ottawa
1100 W 15th St, Ottawa, KS 66067 (1.1 mi from city center)Rock Creek of Ottawa is a modern, state-of-the-art Care Center, Senior Living Community, and Memory Care Home.

Vintage Park at Ottawa
2250 S. Elm, Ottawa, KS 66067 (1.3 mi from city center)Vintage Park at Ottawa offers exceptional Assisted Living lifestyle with personalized 24/7 help in Ottawa, KS.
Map of Assisted Living in Ottawa
Find the right senior living community by location- Cedar Square
- Rock Creek of Ottawa
- Vintage Park at Ottawa
Senior Living Statistics for Ottawa, Kansas
Average Senior Living Costs by Housing Type
Average senior living costs in Ottawa, Kansas range from $3,541 per month for independent living to $5,001 per month for memory care. Some other options include assisted living, which costs $4,814 per month, and a semi-private room in a nursing home, which costs $4,245 per month.
| Housing Type | Average Monthly Cost |
|---|---|
| Assisted Living | $4,814 |
| Memory Care | $5,001 |
| Independent Living | $3,541 |
| Nursing Home: Semi-Private Room | $4,245 |
Average Cost of Assisted Living in Ottawa
The average cost of assisted living is 4814 per month in Ottawa. This is more expensive than other nearby cities, including Garnett and Waverly, which cost an average of $4,130 per month and $4,335 per month, respectively. However, Ottawa assisted living costs are below the state average in Kansas ($4,947) but above the nationwide average of $4,546 per month.
| City | Average Monthly Cost |
|---|---|
| Ottawa | $4,814 |
| Garnett | $4,130 |
| Waverly | $4,335 |
Here is how the average cost of assisted living in Ottawa compares to Kansas and the national average:
| Area | Average Monthly Cost |
|---|---|
| Ottawa | $4,814 |
| Kansas | $4,947 |
| United States | $4,546 |
Senior Living Availability in Ottawa
Ottawa offers 3 of the 291 senior living communities in Kansas. If you decide to extend your search to the cities near Ottawa, there are 3 facilities.
Ottawa
Surrounding Area
Kansas
Ottawa Senior Demographics
Older adults in Ottawa form a vibrant part of the community, as they represent 34.7% of the population. The age groups include 13.7% in their 50s, 11.5% in their 60s, 6.1% in their 70s, and 3.4% in their 80s and over. The gender distribution is nearly balanced with 49.2% male and 50.8% female. Among these seniors, 46.9% are married, 13.7% are divorced, 33.2% have never married, and 6.2% are widowed. The demographic primarily comprises 90.5% White, with a smaller portion identifying as 5.8% mixed race and 4.1% Hispanic.
Population
Ottawa has a population of 12,632.- 49.2% Male
- 50.8% Female
Marital Status
- 46.9% Married
- 13.7% Divorced
- 33.2% Never Married
- 6.2% Widowed
Age
Seniors make up about 34.7% of the population.- 13.7% in their 50s
- 11.5% in their 60s
- 6.1% in their 70s
- 3.4% in their 80s
Diversity
- 90.5% White
- 1.4% Black
- 1.1% Asian
- 0.5% Native
- 0.8% Identifying as Other
- 5.8% Mixed Race
- 4.1% Hispanic
