Best Assisted Living Facilities in Morehead, KY
Find local assisted living and retirement communities in the Morehead, KY area.
Are you exploring senior living in Morehead, Kentucky? With two local facilities and more choices in the surrounding area, Morehead provides various options for high-quality care, including assisted living, independent living, and nursing homes. The average cost of assisted living in Morehead is $3,392 per month, which is quite affordable compared to state and national averages. Whether you prioritize cost, level of care, or amenities, this guide will walk you through some of the top assisted living options in Morehead, ensuring you find the perfect place for your loved one.
- Mount Sterling, KY
- ,
- Adult Day Services
- Assisted Living
- Home Care
- Independent Living
- Memory Care
- Nursing Home
- Residential Care Home
- Senior Apartments
- Distance from City Center
- Highest Rating
- Name: A - Z
- Name: Z - A

Cave Run Manor
1100 Kentucky Hwy 801 S, Morehead, KY 40351 (0.4 mi from city center)Cave Run Manor is an assisted living facility in Morehead, Kentucky.

Life Care Ctr of Morehead
933 N Tolliver Rd, Morehead, KY 40351 (1.3 mi from city center)Life Care Center of Morehead is a skilled nursing home and rehabilitation facility providing 24-hour skilled nursing care and a variety of specialized services.
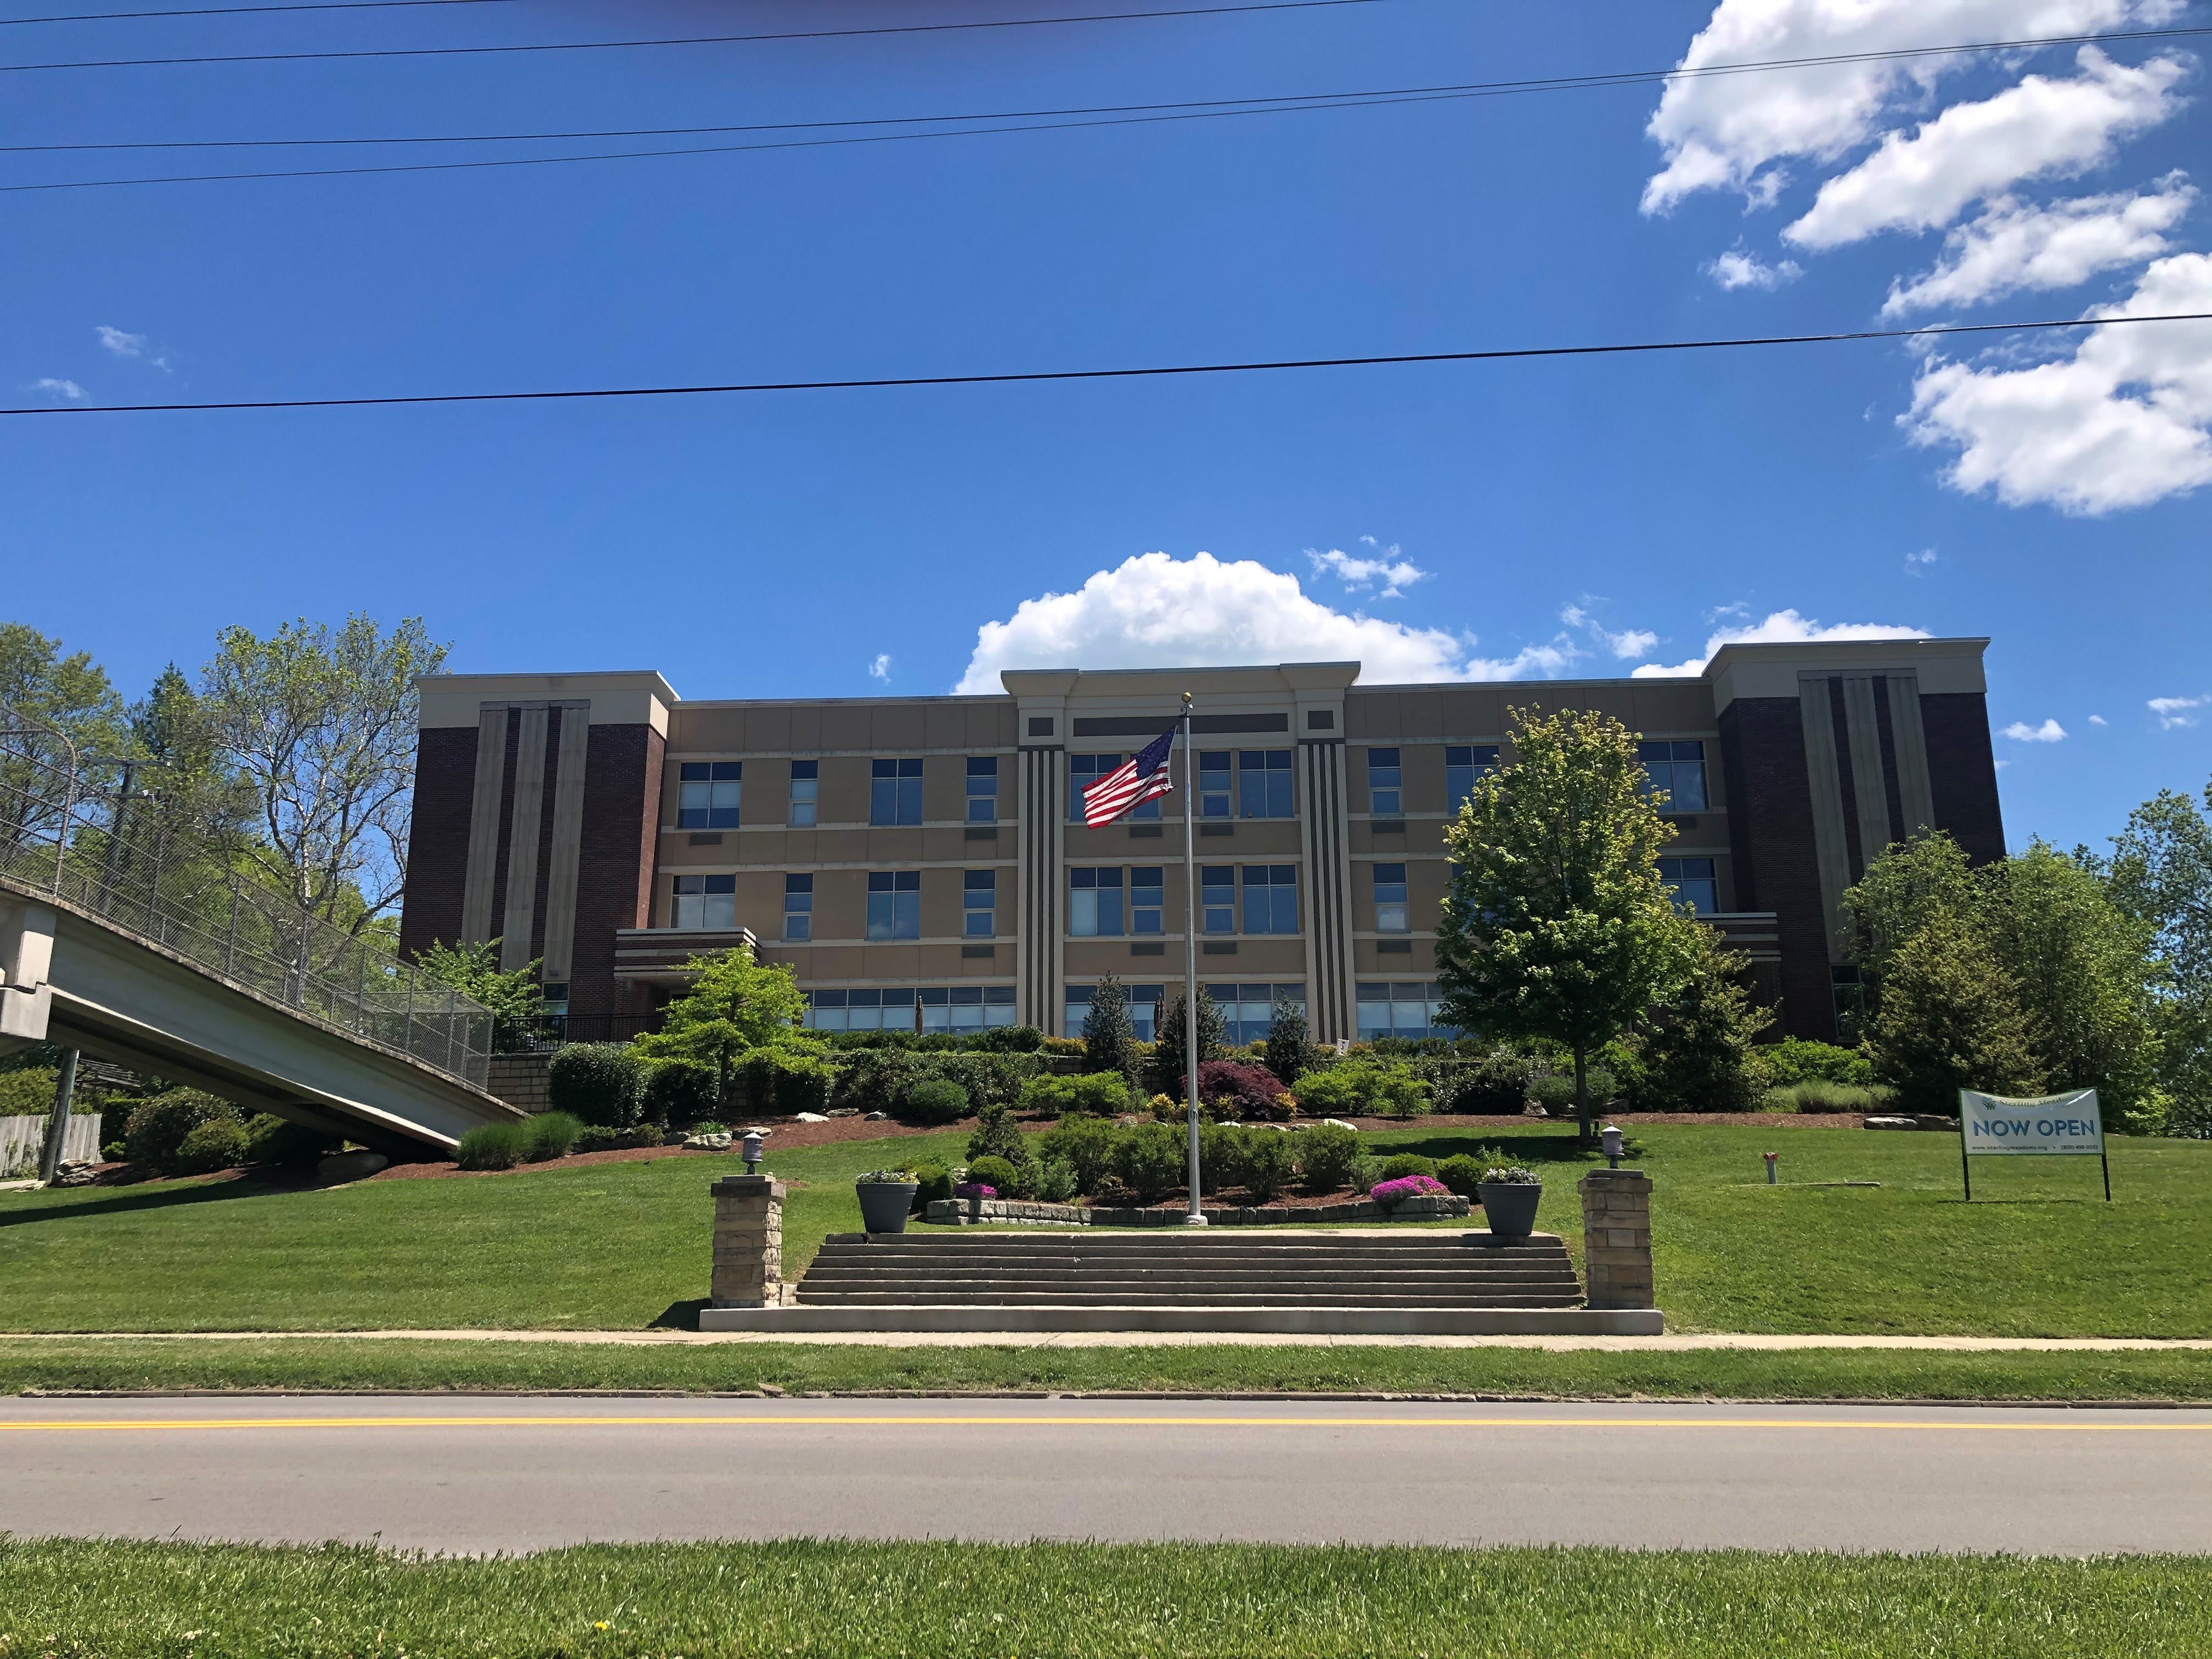
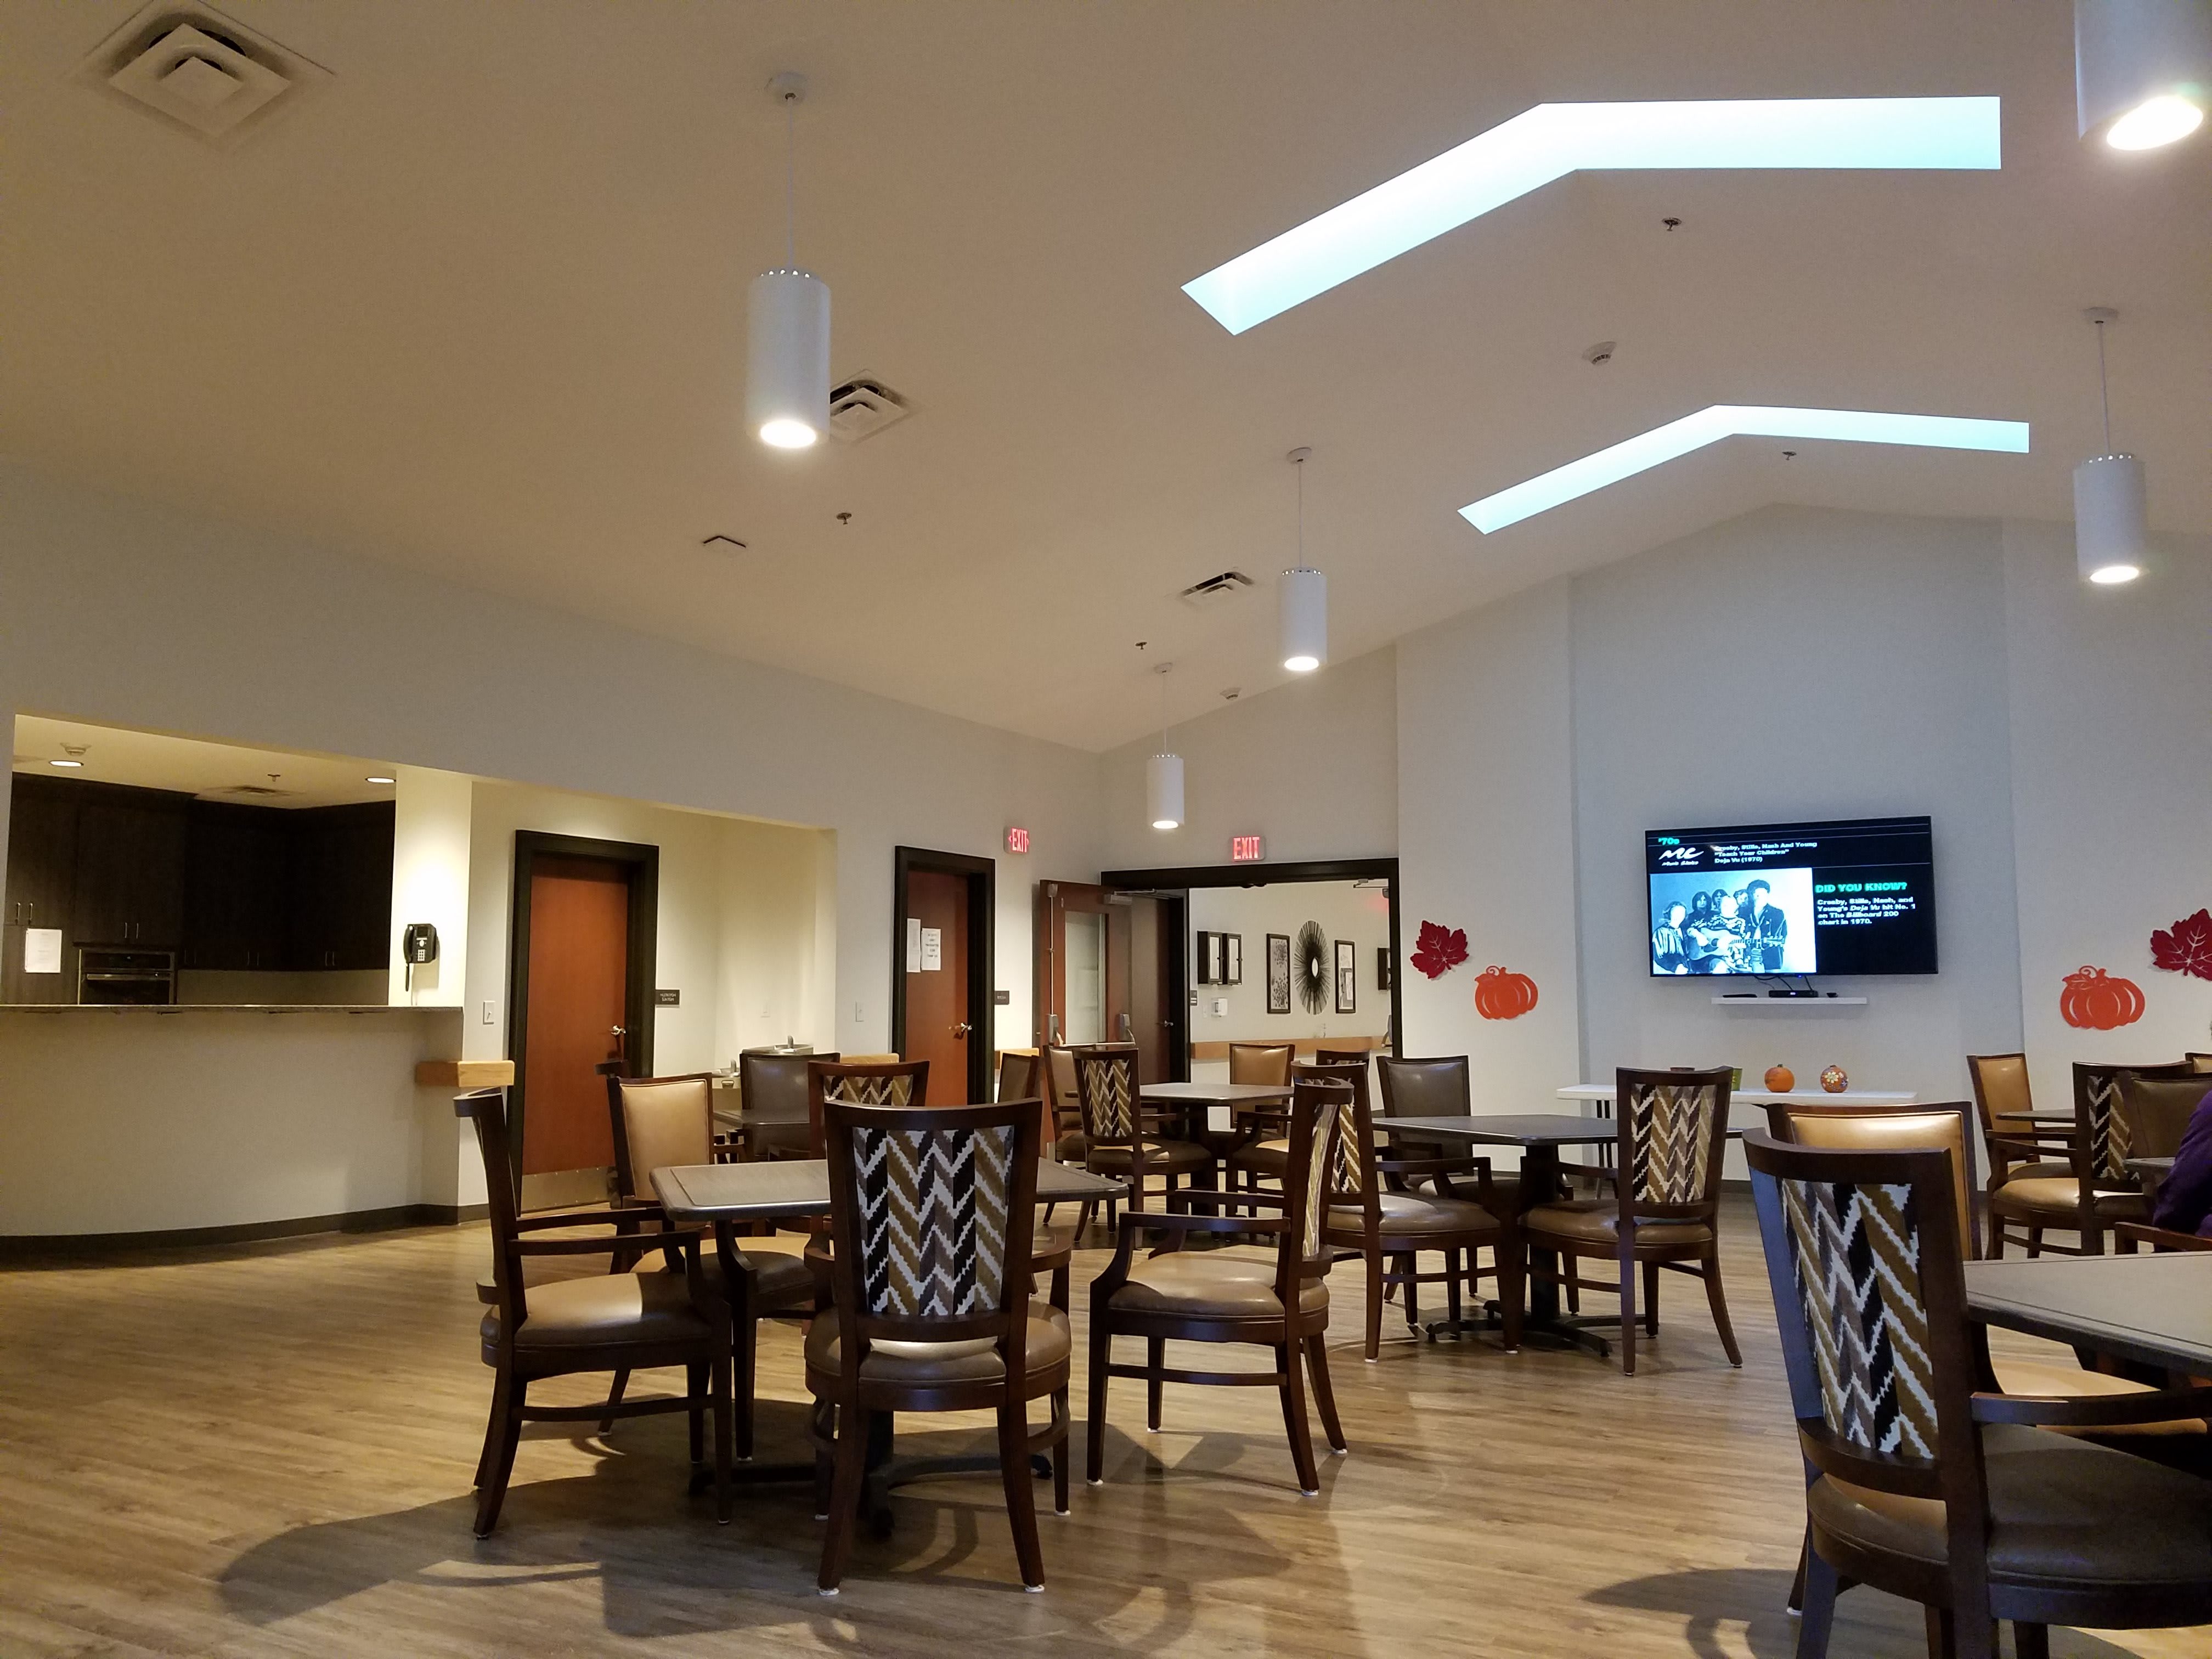
Sterling Meadows Assisted Living
209 N Maysville Rd, Ste 100, Mount Sterling, KY 40353 (28.5 mi from city center)Sterling Meadows is an assisted living facility in Mt. Sterling, Kentucky, offering 30 apartments, a beautiful courtyard, walking paths, and various community-based activities.
Regency Memory Care
130 Sterling Way, Mount Sterling, KY 40353 (28.6 mi from city center)Regency Memory Care is a senior living facility in Mount Sterling, KY, offering memory care services.
Map of Assisted Living in Morehead
Find the right senior living community by location- Cave Run Manor
- Life Care Ctr of Morehead
- Sterling Meadows Assisted Living
- Regency Memory Care
Senior Living Statistics for Morehead, Kentucky
Average Senior Living Costs by Housing Type
Independent living is the least expensive type of senior living in Morehead, Kentucky, starting at $1,934 per month. Conversely, the most costly type of senior living is a one-bedroom unit in a nursing home, which averages $5,841 per month. There are several other options at various price points, including assisted living and memory care, both priced at $3,392 per month. Additionally, a semi-private room in a nursing home costs $3,038, a private room averages $3,496, and a studio unit is available for $3,688 per month. These options offer a variety of choices to accommodate different needs and budgets in Morehead.
| Housing Type | Average Monthly Cost |
|---|---|
| Assisted Living | $3,392 |
| Memory Care | $3,392 |
| Independent Living | $1,934 |
| Nursing Home: Private Room | $3,496 |
| Nursing Home: Semi-Private Room | $3,038 |
| Nursing Home: Studio | $3,688 |
| Nursing Home: One Bedroom | $5,841 |
Average Cost of Assisted Living in Morehead
When compared to the nationwide average for assisted living costs ($4,546 per month), Morehead, Kentucky, is less expensive at $3,392 per month. On the other hand, assisted living in Morehead is more expensive than other nearby cities, such as West Liberty ($2,550 per month) and Flemingsburg ($2,525 per month).
| City | Average Monthly Cost |
|---|---|
| Morehead | $3,392 |
| West Liberty | $2,550 |
| Flemingsburg | $2,525 |
Here is how the average cost of assisted living in Morehead compares to Kentucky and the national average:
| Area | Average Monthly Cost |
|---|---|
| Morehead | $3,392 |
| Kentucky | $4,095 |
| United States | $4,546 |
Senior Living Availability in Morehead
There are 2 different senior living communities in Morehead. If you decide to look for communities near Morehead, there are 4 facilities in the surrounding area. If you want to broaden your search to the state of Kentucky, there are 215 facilities in total, offering a variety of choices across the state.
Morehead
Surrounding Area
Kentucky
Morehead Senior Demographics
In Morehead, Kentucky, seniors make up a modest 15.7% of the total population of 7,001. This includes 6.5% in their 50s, 4% in their 60s, 2.8% in their 70s, and 2.4% who are 80 and older. Morehead's population has a slight female majority, with 52.6% females and 47.4% males. Concerning marital status among seniors, 22.2% are married, 5.3% are divorced, 68.2% have never married, and 4.4% are widowed. The racial composition of Morehead is predominantly White, with 91.2%, and smaller percentages including 3.8% Black, 1.5% Asian, 0.1% Native American, and 5.4% Hispanic. Additionally, 2.9% are mixed race, and 0.5% identify as other, showcasing a largely homogeneous community with some diversity.
Population
Morehead has a population of 7,001.- 47.4% Male
- 52.6% Female
Marital Status
- 22.2% Married
- 5.3% Divorced
- 68.2% Never Married
- 4.4% Widowed
Age
Seniors make up about 15.7% of the population.- 6.5% in their 50s
- 4% in their 60s
- 2.8% in their 70s
- 2.4% in their 80s
Diversity
- 91.2% White
- 3.8% Black
- 1.5% Asian
- 0.1% Native
- 0.5% Identifying as Other
- 2.9% Mixed Race
- 5.4% Hispanic
Additional Cities with Assisted Living Near Morehead
There are limited nearby city options near Morehead, Kentucky, with Mount Sterling offering senior housing at an average cost of $4,249 per month.
Senior Living Ratings Methodology
Our experts spent over 50 hours researching the best communities in each city, focusing on these key factors.

Available Care
We value communities that offer more than standard living services, such as memory care and independent living. We think this is beneficial for older adults, as it allows a community to meet your changing needs over time.
Amenities
Amenities can help an assisted living community feel like a luxury resort or a home away from home. Our research focuses on communities that offer extra perks and benefits for seniors to enjoy.
Location
Location can be important. Since many seniors like to have certain comforts nearby, we look at communities close to parks, shopping areas, hospitals, museums, and other practical or entertaining points of interest.
Reviews
We read through dozens of reviews for every single contender and include a summary of our findings. In most cases, we see common themes regarding positive and negative feedback about each community. Just remember not to take individual reviews at face value.
Cost
Assisted living costs vary greatly based on the facility and level of care. We considered communities that are suitable for various budgets and offer solid value. All prices listed are from community websites.