Best Assisted Living Facilities in Braintree, MA
Find local assisted living and retirement communities in the Braintree, MA area.
In Braintree, Massachusetts, seniors make up a significant 38.7% of the community, contributing to strong demand for diverse senior living accommodations. With five senior living facilities available, Braintree offers various options such as independent living, assisted living, and nursing homes to cater to distinct levels of care. The average cost for assisted living is $7,107 per month, reflective of the high-quality services and amenities provided in the area. Understanding how vital it is to find the perfect environment for your loved ones, this article delves into the top senior living communities in Braintree, ensuring a supportive and enriching setting for their golden years.
- Newton, MA
- Quincy, MA
- Woburn, MA
- Dover, MA
- Danvers, MA
- Boston, MA
- Cambridge, MA
- Needham, MA
- Plymouth, MA
- Dedham, MA
- Canton, MA
- Beverly, MA
- Framingham, MA
- Milford, MA
- Norwood, MA
- Norwell, MA
- Portsmouth, MA
- Lynn, MA
- Adult Day Services
- Assisted Living
- Home Care
- Independent Living
- Memory Care
- Nursing Home
- Residential Care Home
- Senior Apartments
- Distance from City Center
- Highest Rating
- Name: A - Z
- Name: Z - A

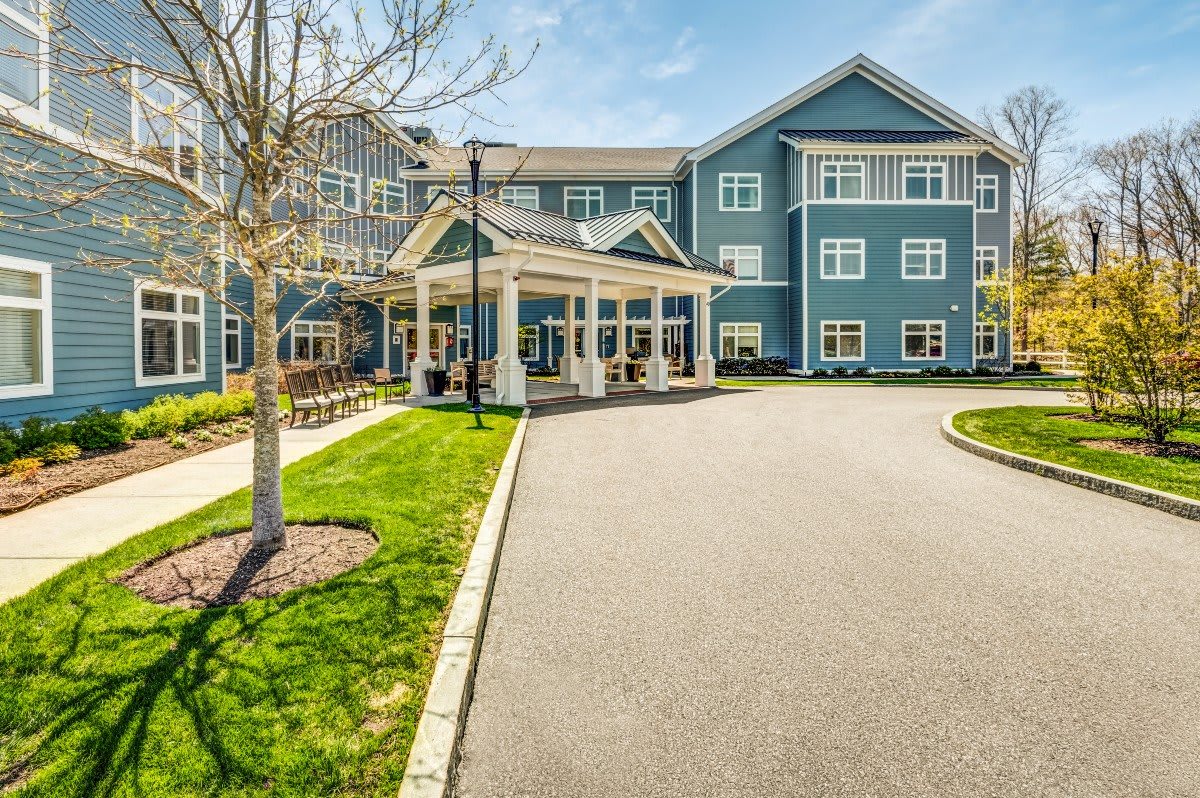
Benchmark Senior Living on Clapboardtree
40 Clapboardtree St, Norwood, MA 02062 (9.8 mi from city center)Map of Assisted Living in Braintree
Find the right senior living community by location- Benchmark Senior Living on Clapboardtree
Senior Living Statistics for Braintree, Massachusetts
Average Senior Living Costs by Housing Type
Average senior living costs in Braintree, Massachusetts, range from $6,589 per month for independent living to $8,109 per month for a one-bedroom unit in a nursing home. There are plenty of options in between, including assisted living at $7,107 and memory care at $7,105 per month. For nursing home options, a semi-private room averages $6,888, a studio comes in at $7,313, and a private room costs $7,399. These diverse accommodations allow for personalized care that fits various preferences and financial plans.
| Housing Type | Average Monthly Cost |
|---|---|
| Assisted Living | $7,107 |
| Memory Care | $7,105 |
| Independent Living | $6,589 |
| Nursing Home: Private Room | $7,399 |
| Nursing Home: Semi-Private Room | $6,888 |
| Nursing Home: Studio | $7,313 |
| Nursing Home: One Bedroom | $8,109 |
Average Cost of Assisted Living in Braintree
When compared to nearby cities, Braintree senior living is relatively more expensive. The average monthly cost of assisted living is $7,107 in Braintree, $5,948 in Taunton, and $6,294 in Norton Center.
| City | Average Monthly Cost |
|---|---|
| Braintree | $7,107 |
Here is how the average cost of assisted living in Braintree compares to Massachusetts and the national average:
| Area | Average Monthly Cost |
|---|---|
| Braintree | $7,107 |
| Massachusetts | $6,822 |
| United States | $4,546 |
Senior Living Availability in Braintree
Wondering how many options there are for senior living in and around Braintree? The city has 5 communities, while the surrounding area has 285, and the state of Massachusetts has 365.
Braintree
Surrounding Area
Massachusetts
Braintree Senior Demographics
In Braintree, Massachusetts, 38.7% of the city’s 38,748 residents are seniors, distributed across ages with 15.2% in their 50s, 10.8% in their 60s, 7.7% in their 70s, and 5% aged 80 and above. The population is balanced in terms of gender, with roughly 49.9% male and 50.1% female. Marital status among seniors shows 50.6% are married, 9.1% are divorced, 33.9% have never married, and 6.5% are widowed. In terms of diversity, Braintree’s seniors are predominantly White at 70.7%, followed by 20.7% Asian, 4.3% mixed race, and 2.9% Hispanic. Smaller communities include 3.3% Black and 0.9% identifying as other, creating a vibrant and varied demographic landscape.
Population
Braintree has a population of 38,748.- 49.9% Male
- 50.1% Female
Marital Status
- 50.6% Married
- 9.1% Divorced
- 33.9% Never Married
- 6.5% Widowed
Age
Seniors make up about 38.7% of the population.- 15.2% in their 50s
- 10.8% in their 60s
- 7.7% in their 70s
- 5% in their 80s
Diversity
- 70.7% White
- 3.3% Black
- 20.7% Asian
- 0.9% Identifying as Other
- 4.3% Mixed Race
- 2.9% Hispanic
Additional Cities with Assisted Living Near Braintree
Some of the least expensive options for senior living near Braintree, Massachusetts, include Dover and Milford, costing an average of $5,999 and $6,754 per month, respectively. A few of the most expensive cities for senior housing are Lynn and Boston, with monthly averages of $7,236 and $7,213, respectively.
| City | Average Monthly Cost |
|---|
| City | Average Monthly Cost |
|---|---|
| Newton | $7,029 |
| Quincy | $7,120 |
| Woburn | $7,178 |
| Dover | $5,999 |
| Danvers | $7,202 |
| Boston | $7,213 |
| Cambridge | $7,080 |
| Needham | $6,942 |
| Plymouth | $7,315 |
| City | Average Monthly Cost |
|---|---|
| Dedham | $6,969 |
| Canton | $6,992 |
| Beverly | $6,980 |
| Framingham | $6,998 |
| Milford | $6,754 |
| Norwood | $6,940 |
| Norwell | $6,910 |
| Portsmouth | $6,125 |
| Lynn | $7,236 |
