Best Assisted Living Facilities in Alma, MI
Find local assisted living and retirement communities in the Alma, MI area.
Whether you're a Alma resident looking for assisted living or considering moving to the city for senior care, there are plenty of options to meet your needs, lifestyle, and budget. There are 2 facilities in total to support the city's seniors, which make up around 32.3% of the population. Wondering how much assisted living costs in the city? Monthly average costs currently sit at $3,940. This article will discuss the best assisted living options in Alma to help you find the right home for your loved one.
- Adult Day Services
- Assisted Living
- Home Care
- Independent Living
- Memory Care
- Nursing Home
- Residential Care Home
- Respite Care
- Senior Apartments
- Distance from City Center
- Highest Rating
- Name: A - Z
- Name: Z - A

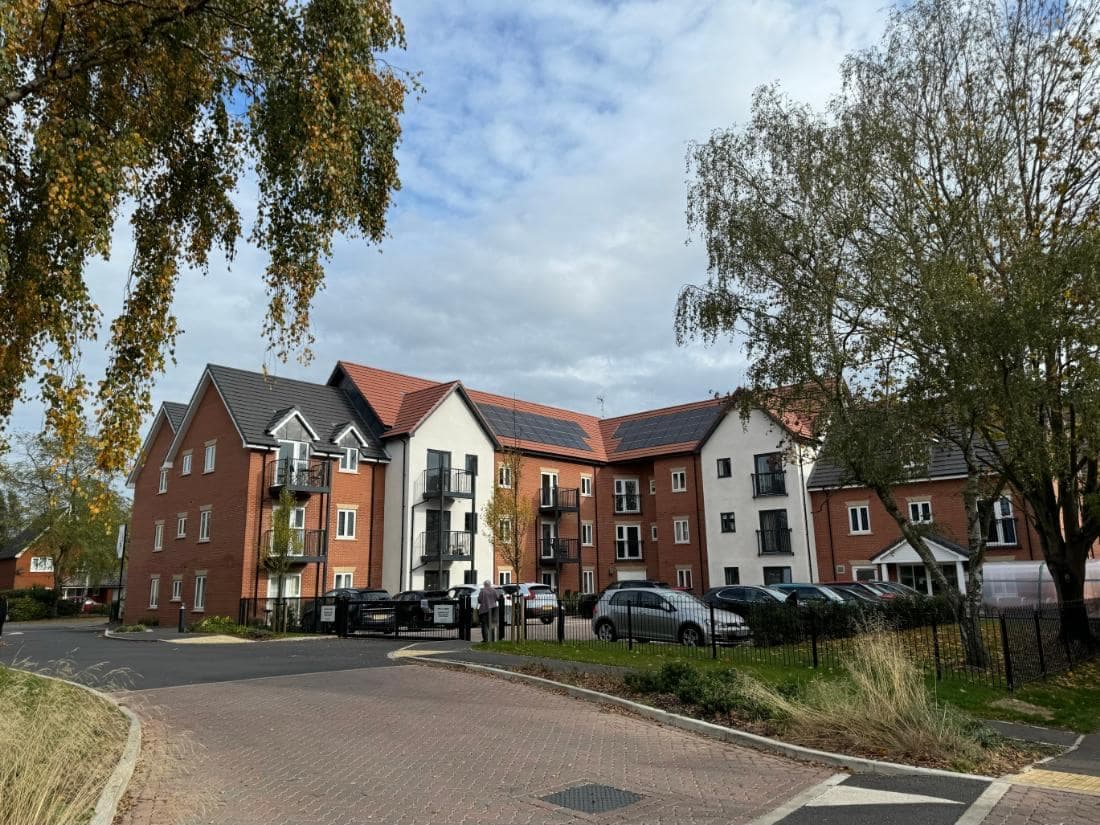
Arbor Grove Assisted Living and Memory Care
1320 Pine Ave, Alma, MI 48801 (0.6 mi from city center)Arbor Grove Assisted Living and Memory Care is a senior living community in Alma, Michigan, offering independent living, assisted living, and memory care services.
Michigan Masonic Home
1200 Wright Ave, Alma, MI 48801 (0.9 mi from city center)Michigan Masonic Home is a not-for-profit senior living community offering independent and assisted living, short-stay rehabilitation, skilled nursing, and memory care support.
Laurels of Fulton
4735 W Ranger Rd, Perrinton, MI 48871 (15.7 mi from city center)The Laurels of Fulton is a 50-bed skilled nursing and rehabilitation center providing short-term and long-term care.
Map of Assisted Living in Alma
Find the right senior living community by location- Arbor Grove Assisted Living and Memory Care
- Michigan Masonic Home
- Laurels of Fulton
Senior Living Statistics for Alma, Michigan
Average Senior Living Costs by Housing Type
If you're looking for the least expensive senior living option in Alma, Michigan, it's independent living, which costs an average of $3,178 per month. Costs for care range up to $5,800 per month for a private room in a nursing home. Other options include assisted living and memory care, both priced at $3,940 per month, as well as a nursing home studio at $3,484.
| Housing Type | Average Monthly Cost |
|---|---|
| Assisted Living | $3,940 |
| Memory Care | $3,940 |
| Independent Living | $3,178 |
| Nursing Home: Private Room | $5,800 |
| Nursing Home: Semi-Private Room | $4,950 |
| Nursing Home: Studio | $3,484 |
Average Cost of Assisted Living in Alma
On average, assisted living costs 3940 per month in Alma, which is more than some other cities in the area, including Carson City ($3,589 per month) and Maple Rapids ($3,632 per month). However, Alma assisted living costs are slightly lower than both the state average in Michigan ($4,163) and the national average ($4,546 per month).
| City | Average Monthly Cost |
|---|---|
| Alma | $3,940 |
| Carson City | $3,589 |
| Maple Rapids | $3,632 |
Here is how the average cost of assisted living in Alma compares to Michigan and the national average:
| Area | Average Monthly Cost |
|---|---|
| Alma | $3,940 |
| Michigan | $4,163 |
| United States | $4,546 |
Senior Living Availability in Alma
Alma residents have 2 senior living facilities to choose from. In the surrounding area, there are 3 communities, and the state offers a total of 889 facilities.
Alma
Surrounding Area
Michigan
Alma Senior Demographics
In Alma, the population distribution includes 47.2% males and 52.8% females. Seniors represent 32.3% of the population, featuring 7% in their 50s, 14.5% in their 60s, 5.4% in their 70s, and 5.4% over 80. Regarding marital status, 44.7% are married, 9.5% divorced, 40.7% never married, and 5.1% widowed. The town's diversity includes 88.6% White, 2.8% Black, 1.4% Asian, 0.2% Native American, and 12.8% Hispanic, with 4.7% identifying as mixed race.
Population
Alma has a population of 9,421.- 47.2% Male
- 52.8% Female
Marital Status
- 44.7% Married
- 9.5% Divorced
- 40.7% Never Married
- 5.1% Widowed
Age
Seniors make up about 32.3% of the population.- 7% in their 50s
- 14.5% in their 60s
- 5.4% in their 70s
- 5.4% in their 80s
Diversity
- 88.6% White
- 2.8% Black
- 1.4% Asian
- 0.2% Native
- 2.3% Identifying as Other
- 4.7% Mixed Race
- 12.8% Hispanic
Senior Living Ratings Methodology
Our experts spent over 50 hours researching the best communities in each city, focusing on these key factors.

Available Care
We value communities that offer more than standard living services, such as memory care and independent living. We think this is beneficial for older adults, as it allows a community to meet your changing needs over time.
Amenities
Amenities can help an assisted living community feel like a luxury resort or a home away from home. Our research focuses on communities that offer extra perks and benefits for seniors to enjoy.
Location
Location can be important. Since many seniors like to have certain comforts nearby, we look at communities close to parks, shopping areas, hospitals, museums, and other practical or entertaining points of interest.
Reviews
We read through dozens of reviews for every single contender and include a summary of our findings. In most cases, we see common themes regarding positive and negative feedback about each community. Just remember not to take individual reviews at face value.
Cost
Assisted living costs vary greatly based on the facility and level of care. We considered communities that are suitable for various budgets and offer solid value. All prices listed are from community websites.