Best Assisted Living Facilities in Plymouth, MI
Find local assisted living and retirement communities in the Plymouth, MI area.
Plymouth, Michigan is a city where 40.8% of the population is made up of seniors, showcasing its appeal as a place for older adults to retire and enjoy their golden years. With ten senior living facilities in the city and nearly 380 in the surrounding areas, Plymouth offers a broad range of options including independent living, assisted living, memory care, and nursing homes. Assisted living here averages at $4,262 per month, providing a good balance between cost and quality of care. This guide will introduce you to some of Plymouth's top senior living communities known for their exceptional services, amenities, and strong reputation, helping you or your loved one find an ideal place to call home.
- Farmington Hills, MI
- Sterling Heights, MI
- Troy, MI
- Rochester Hills, MI
- Southfield, MI
- Detroit, MI
- Livonia, MI
- Warren, MI
- Canton, MI
- Northville, MI
- Westland, MI
- Utica, MI
- Clarkston, MI
- Fenton, MI
- Novi, MI
- Bloomfield Hills, MI
- Waterford, MI
- St. Clair Shores, MI
- Adult Day Services
- Assisted Living
- Home Care
- Independent Living
- Memory Care
- Nursing Home
- Residential Care Home
- Senior Apartments
- Distance from City Center
- Highest Rating
- Name: A - Z
- Name: Z - A

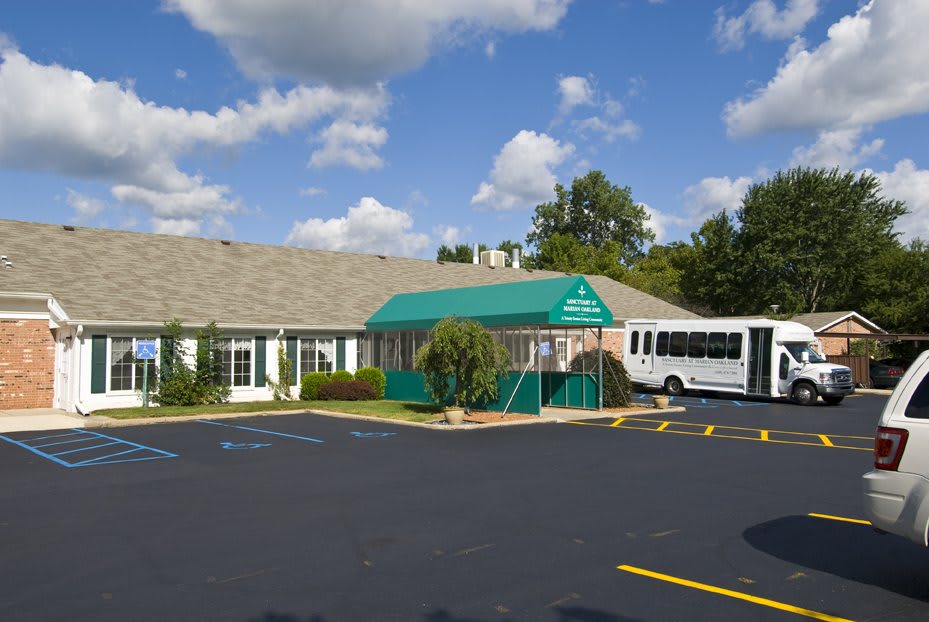
Marian Oakland
29250 W 10 Mile Rd, Farmington Hills, MI 48336 (9.7 mi from city center)
Orchard View Care Home
26450 Orchard Lake Road, Farmington Hills, MI 48334 (9.8 mi from city center)Map of Assisted Living in Plymouth
Find the right senior living community by location- The Orchards at Redford Village
- Amada Senior Care of Farmington Hills, MI
- Marian Oakland
- Orchard View Care Home
Senior Living Statistics for Plymouth, Michigan
Average Senior Living Costs by Housing Type
Plymouth, Michigan, offers several types of senior housing to fit various budgets. The most expensive option is a two-bedroom unit in a nursing home, averaging $5,644 per month. On the other end, the least expensive option is independent living, which averages $3,983 per month. Assisted living is another relatively affordable choice at $4,262 per month, while memory care and different types of nursing home units, like a private room ($5,050) and a studio ($5,239), are on the pricier side. This variety allows for flexibility in selecting the best housing option to meet personal preferences and needs.
| Housing Type | Average Monthly Cost |
|---|---|
| Assisted Living | $4,262 |
| Memory Care | $5,288 |
| Independent Living | $3,983 |
| Nursing Home: Private Room | $5,050 |
| Nursing Home: Semi-Private Room | $4,610 |
| Nursing Home: Studio | $5,239 |
| Nursing Home: One Bedroom | $5,345 |
| Nursing Home: Two Bedroom | $5,644 |
Average Cost of Assisted Living in Plymouth
Compared to other cities in the area, Plymouth is slightly more expensive. For instance, Westland assisted living costs an average of $4,225 per month, and Franklin is $4,222 per month. On the flip side, Plymouth is less expensive than the national average, which is $4,546 per month.
| City | Average Monthly Cost |
|---|---|
| Plymouth | $4,262 |
Here is how the average cost of assisted living in Plymouth compares to Michigan and the national average:
| Area | Average Monthly Cost |
|---|---|
| Plymouth | $4,262 |
| Michigan | $4,163 |
| United States | $4,546 |
Senior Living Availability in Plymouth
If you don't find the senior living option that's right for you in Plymouth, Michigan, there are many options outside of the city. The surrounding area offers 380 facilities to choose from, while the entire state of Michigan provides a total of 753 facilities, ensuring a broad selection to accommodate diverse needs.
Plymouth
Surrounding Area
Michigan
Plymouth Senior Demographics
In Plymouth, Michigan, seniors represent a vital 40.8% of the population, which totals 9,300 residents. With a slight female majority, the population is 52.2% female and 47.8% male. Age-wise, 17.7% of the community's seniors enjoy life in their 50s, 12.2% in their 60s, 6.8% in their 70s, and 4.1% are in their 80s and over. Marital status varies among these seniors: 48% are married, 13.2% are divorced, 30.7% never married, and 8.1% are widowed. The city's racial demographics are primarily White, at 90.3%, with smaller groups comprised of 2.6% Black, 2% Asian, and 2% Hispanic individuals, further complemented by 4.1% identifying as mixed race and 0.9% as other, reflecting a modest but diverse community fabric.
Population
Plymouth has a population of 9,300.- 47.8% Male
- 52.2% Female
Marital Status
- 48% Married
- 13.2% Divorced
- 30.7% Never Married
- 8.1% Widowed
Age
Seniors make up about 40.8% of the population.- 17.7% in their 50s
- 12.2% in their 60s
- 6.8% in their 70s
- 4.1% in their 80s
Diversity
- 90.3% White
- 2.6% Black
- 2% Asian
- 0.2% Native
- 0.9% Identifying as Other
- 4.1% Mixed Race
- 2% Hispanic
Additional Cities with Assisted Living Near Plymouth
The average cost of senior housing in Plymouth, Michigan, is similar to nearby cities. For instance, Farmington Hills averages $4,242 per month, while Detroit and Bloomfield Hills both stand at $4,246. Slightly higher are Troy at $4,420 and Rochester Hills at $4,482. Meanwhile, more affordable options can be found in St. Clair Shores at $3,948. This range of prices provides various options for budget-conscious older adults seeking comfort and care in the region.
| City | Average Monthly Cost |
|---|
| City | Average Monthly Cost |
|---|---|
| Farmington Hills | $4,242 |
| Sterling Heights | $4,309 |
| Troy | $4,420 |
| Rochester Hills | $4,482 |
| Southfield | $4,408 |
| Detroit | $4,246 |
| Livonia | $4,294 |
| Warren | $4,223 |
| Canton | $4,319 |
| City | Average Monthly Cost |
|---|---|
| Northville | $4,328 |
| Westland | $4,225 |
| Utica | $4,302 |
| Clarkston | $4,558 |
| Fenton | $4,583 |
| Novi | $4,361 |
| Bloomfield Hills | $4,246 |
| Waterford | $4,355 |
| St. Clair Shores | $3,948 |


