Best Assisted Living Facilities in McComb, MS
Find local assisted living and retirement communities in the McComb, MS area.
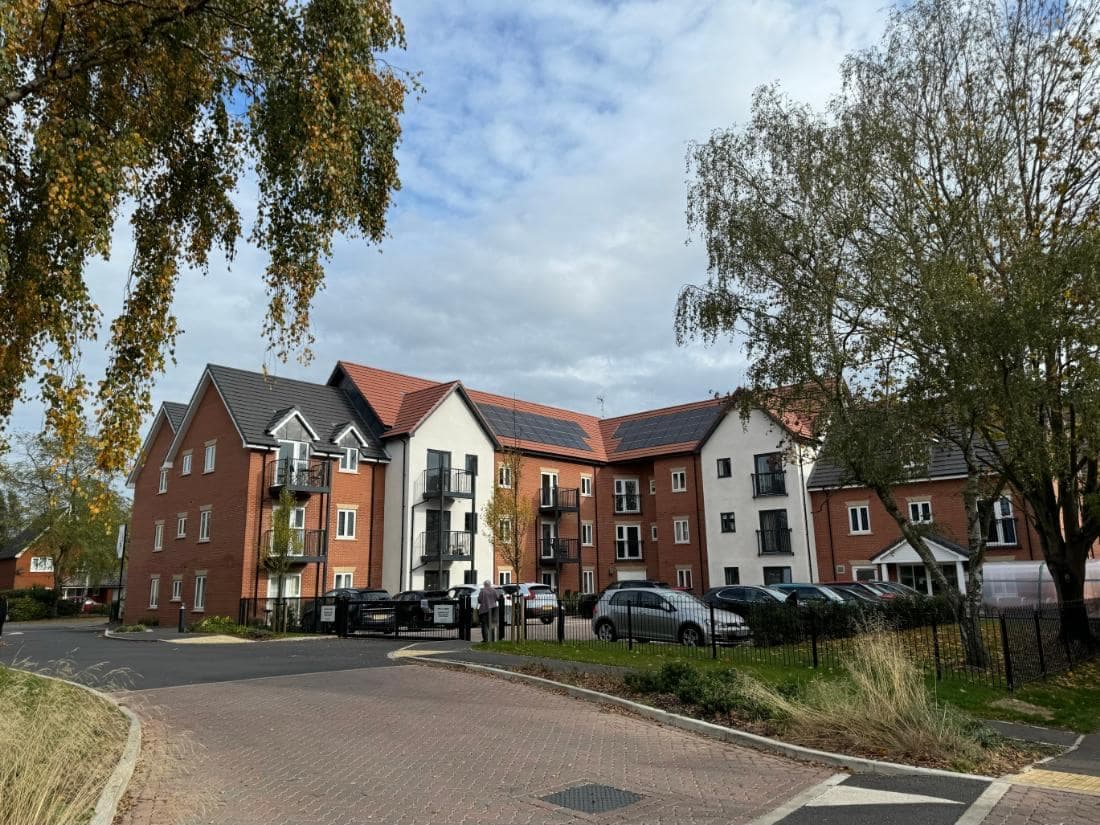
If you are looking for senior living in McComb, there are options to consider. The city's 3 senior living facilities cater to a significant senior population, which makes up about 36.3% of the residents. Keep reading to learn about the best senior living in McComb. We'll highlight communities that are known for excellent services, amenities, and value.
- Adult Day Services
- Assisted Living
- Home Care
- Independent Living
- Memory Care
- Nursing Home
- Residential Care Home
- Respite Care
- Senior Apartments
- Distance from City Center
- Highest Rating
- Name: A - Z
- Name: Z - A
Aston Court Retirement Comm
222 Aston Ave, McComb, MS 39648 (0.7 mi from city center)Aston Court Retirement Community is a family-owned and operated assisted living facility in McComb, MS, offering comfort and relaxation with various amenities and services.

Camellia Estates
1714 White St, McComb, MS 39648 (0.7 mi from city center)Camellia Estates is a health care community offering individuals a place to recover, rehabilitate and/or reside, depending on their specific needs.

The Claiborne at McComb
209 Doug Rushing Dr, McComb, MS 39648 (7.6 mi from city center)The Claiborne at McComb is a senior living community offering assisted living and memory care services in McComb, Mississippi.
Map of Assisted Living in McComb
Find the right senior living community by location- Aston Court Retirement Comm
- Camellia Estates
- The Claiborne at McComb
Senior Living Statistics for McComb, Mississippi
Senior Living Availability in McComb
McComb residents have 3 senior living facilities to choose from. In the surrounding area, there are 3 communities, and the state offers a total of 130 facilities.
McComb
Surrounding Area
Mississippi
McComb Senior Demographics
In McComb, the population is composed of 44.1% male and 55.9% female residents. About 30% are married, 21.6% are divorced, 38.6% have never married, and 9.8% are widowed. As for diversity, 22.3% are White, 75% are Black, 0.7% are mixed race, and 2.1% are Hispanic. Seniors make up 36.3% of the total population, with 11.5% in their 50s, 11.1% in their 60s, 10.1% in their 70s, and 3.6% in their 80s.
Population
McComb has a population of 12,202.- 44.1% Male
- 55.9% Female
Marital Status
- 30% Married
- 21.6% Divorced
- 38.6% Never Married
- 9.8% Widowed
Age
Seniors make up about 36.3% of the population.- 11.5% in their 50s
- 11.1% in their 60s
- 10.1% in their 70s
- 3.6% in their 80s
Diversity
- 22.3% White
- 75% Black
- 0.4% Asian
- 0.4% Native
- 1.2% Identifying as Other
- 0.7% Mixed Race
- 2.1% Hispanic
Senior Living Ratings Methodology
Our experts spent over 50 hours researching the best communities in each city, focusing on these key factors.

Available Care
We value communities that offer more than standard living services, such as memory care and independent living. We think this is beneficial for older adults, as it allows a community to meet your changing needs over time.
Amenities
Amenities can help an assisted living community feel like a luxury resort or a home away from home. Our research focuses on communities that offer extra perks and benefits for seniors to enjoy.
Location
Location can be important. Since many seniors like to have certain comforts nearby, we look at communities close to parks, shopping areas, hospitals, museums, and other practical or entertaining points of interest.
Reviews
We read through dozens of reviews for every single contender and include a summary of our findings. In most cases, we see common themes regarding positive and negative feedback about each community. Just remember not to take individual reviews at face value.
Cost
Assisted living costs vary greatly based on the facility and level of care. We considered communities that are suitable for various budgets and offer solid value. All prices listed are from community websites.