Best Assisted Living Facilities in Rolla, MO
Find local assisted living and retirement communities in the Rolla, MO area.
There are 3 senior living facilities in Rolla, ranging from independent living communities to nursing homes. Costs, amenities, and levels of care will vary significantly depending on your chosen community, though the average cost of assisted living in the city is $3,293 per month. This guide will discuss the best senior living options in Rolla to help you find the community that's the right fit for you or a loved one.
- Salem, MO
- ,
- Adult Day Services
- Assisted Living
- Home Care
- Independent Living
- Memory Care
- Nursing Home
- Residential Care Home
- Respite Care
- Senior Apartments
- Distance from City Center
- Highest Rating
- Name: A - Z
- Name: Z - A

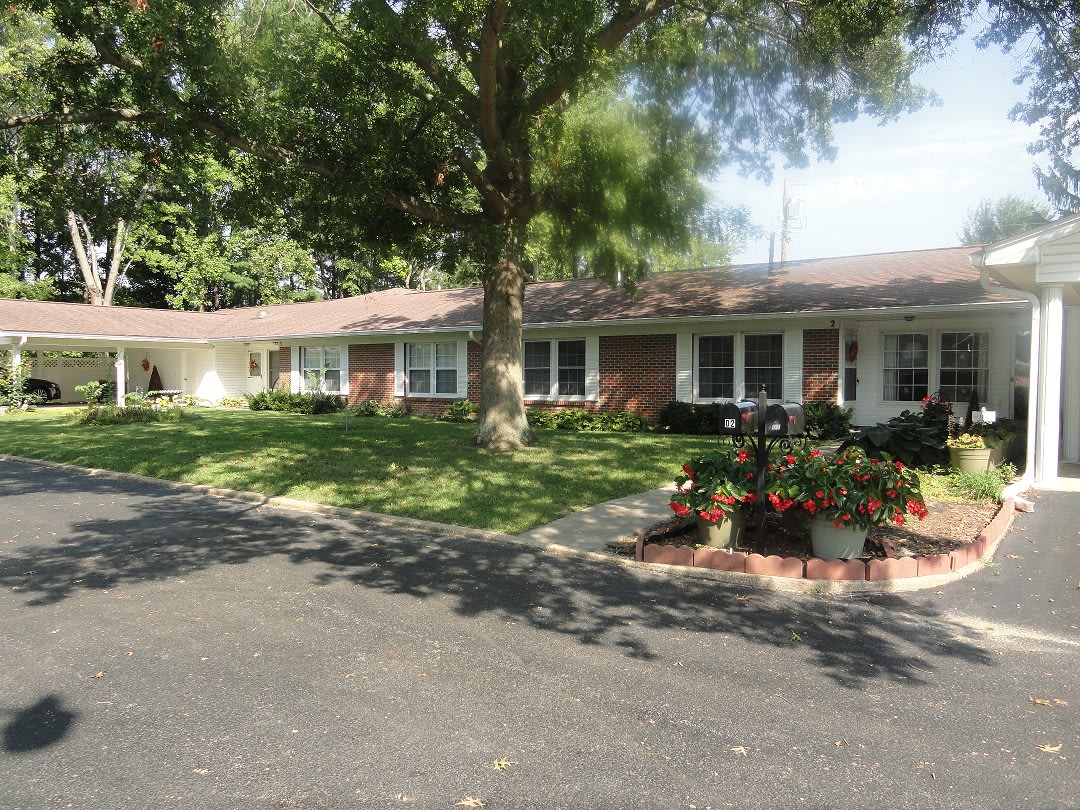
Oak Pointe of Rolla
1000 East Lions Club Dr, Rolla, MO 65401 (0.4 mi from city center)Oak Pointe of Rolla is a senior living community offering assisted living and memory care services in a warm and welcoming environment.

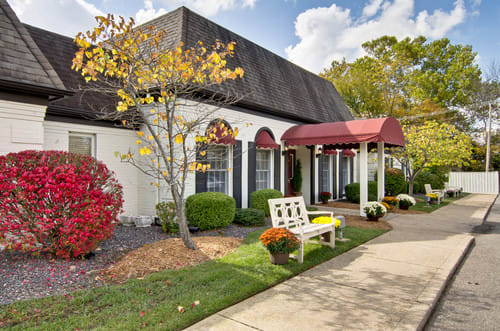
Rolla Presbyterian Manor
1202 Homelife Plz, Rolla, MO 65401 (0.6 mi from city center)Rolla Presbyterian Manor is a faith-based, not-for-profit senior living community offering independent living, assisted living, memory care, long-term care, and short-term rehabilitation services.

Arbors At Parkside - Memory Care Assisted Living By Americare
1700 E 10th St, Rolla, MO 65401 (1 mi from city center)The Arbors at Parkside provides compassionate senior living solutions in Rolla, MO.

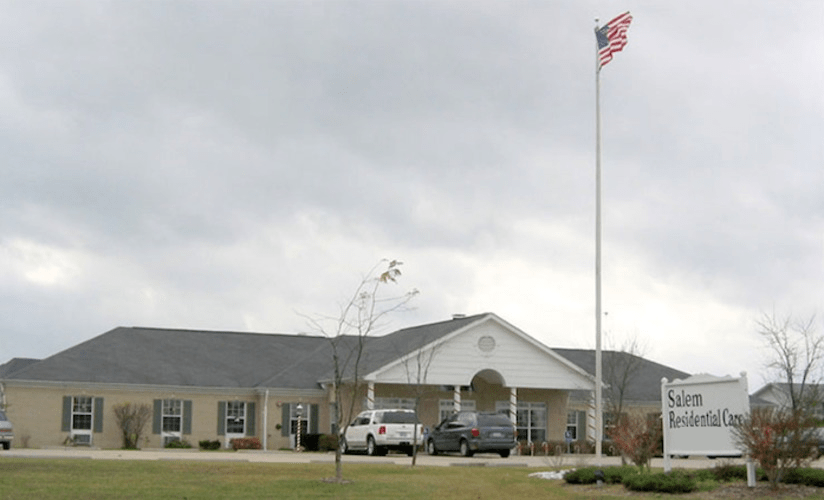
Salem Residential Care
1207 E Roosevelt St, Salem, MO 65560 (25.4 mi from city center)Salem Residential Care is an Assisted Living community located at 1207 East Roosevelt Street in Salem, MO, offering personalized care and a nurturing environment.
Map of Assisted Living in Rolla
Find the right senior living community by location- Oak Pointe of Rolla
- Rolla Presbyterian Manor
- Arbors At Parkside - Memory Care Assisted Living By Americare
- Salem Residential Care
Senior Living Statistics for Rolla, Missouri
Average Senior Living Costs by Housing Type
Rolla, Missouri offers several types of senior housing at various price points. The most expensive option in the city is a studio unit in a nursing home, averaging $6,500 per month. Meanwhile, the least expensive option is assisted living, which averages $3,293 per month. Independent living is another fairly affordable option at $3,524 per month, while memory care and other nursing home units are on the pricier side.
| Housing Type | Average Monthly Cost |
|---|---|
| Assisted Living | $3,293 |
| Memory Care | $4,398 |
| Independent Living | $3,524 |
| Nursing Home: Private Room | $5,900 |
| Nursing Home: Semi-Private Room | $4,068 |
| Nursing Home: Studio | $6,500 |
Average Cost of Assisted Living in Rolla
When compared to the nationwide average for assisted living costs ($4,546 per month), Rolla is less expensive at 3293 per month. On the other hand, assisted living in Rolla is more expensive than other nearby cities, such as Bourbon ($3,017 per month) and Leasburg ($2,955 per month). Additionally, Rolla is also below the Missouri state average of $3,803.
| City | Average Monthly Cost |
|---|---|
| Rolla | $3,293 |
| Bourbon | $3,017 |
| Leasburg | $2,955 |
Here is how the average cost of assisted living in Rolla compares to Missouri and the national average:
| Area | Average Monthly Cost |
|---|---|
| Rolla | $3,293 |
| Missouri | $3,803 |
| United States | $4,546 |
Senior Living Availability in Rolla
There are currently 3 senior living facilities to choose from in Rolla, Missouri. Still considering where you or your loved one will settle? The surrounding area has 4 facilities to choose from, and there are a total of 519 facilities in the state of Missouri.
Rolla
Surrounding Area
Missouri
Rolla Senior Demographics
In Rolla, the population skews slightly more male at 54.4% compared to 45.6%. Seniors make up 25.3% of the population, with 6.7% in their 50s, 8.1% in their 60s, 6% in their 70s, and 4.5% in their 80s and over. Regarding marital status, 30.3% are married, 12.6% are divorced, 51.3% have never married, and 5.9% are widowed. The city is predominantly 83.1% White, with 6.1% Asian and 3.7% Hispanic residents contributing to its diversity.
Population
Rolla has a population of 20,144.- 54.4% Male
- 45.6% Female
Marital Status
- 30.3% Married
- 12.6% Divorced
- 51.3% Never Married
- 5.9% Widowed
Age
Seniors make up about 25.3% of the population.- 6.7% in their 50s
- 8.1% in their 60s
- 6% in their 70s
- 4.5% in their 80s
Diversity
- 83.1% White
- 3.5% Black
- 6.1% Asian
- 0.2% Native
- 1% Identifying as Other
- 6% Mixed Race
- 3.7% Hispanic
Additional Cities with Assisted Living Near Rolla
Nearby cities offer senior living options at a range of prices near Rolla, Missouri. You can find average senior housing prices as low as $3,849 per month in Salem.
