Best Assisted Living Facilities in Ashland, OH
Find local assisted living and retirement communities in the Ashland, OH area.
In Ashland, Ohio, seniors comprise about 39% of the population, making it a community well-attuned to the needs of its older residents. For those considering senior living options, there are five facilities within the city and another five in the surrounding areas, offering a range of care from independent and assisted living to dedicated memory care and nursing homes. With assisted living costs averaging $4,301 per month, Ashland provides valuable options for quality senior care. This guide is designed to ease the decision-making process by spotlighting the best assisted living communities in Ashland, ensuring you find the most suitable care and amenities for yourself or a loved one.
- Adult Day Services
- Assisted Living
- Home Care
- Independent Living
- Memory Care
- Nursing Home
- Residential Care Home
- Senior Apartments
- Distance from City Center
- Highest Rating
- Name: A - Z
- Name: Z - A

St. Martin Management
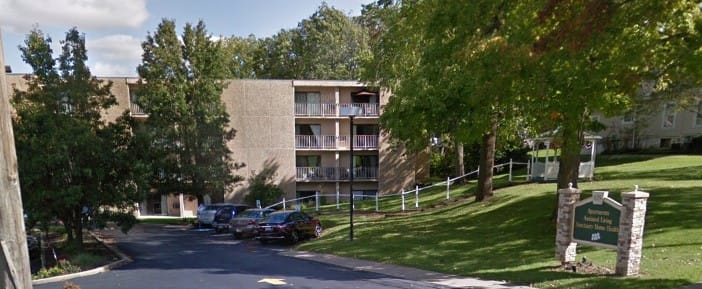
625 Center Street, Ashland, OH 44805 (0.3 mi from city center)St. Martin Management is an assisted living facility in Ashland, OH, offering a supportive environment with comprehensive care services, including 12-16 hour nursing, a 24-hour call system, and assistance with daily activities.

The Inn at Ashland Woods
1050 Dauch Dr, Ashland, OH 44805 (0.9 mi from city center)The Inn at Ashland Woods is a premier assisted living residence offering personalized care services, including memory care, in a nurturing and vibrant environment.

Lutheran Village of Ashland
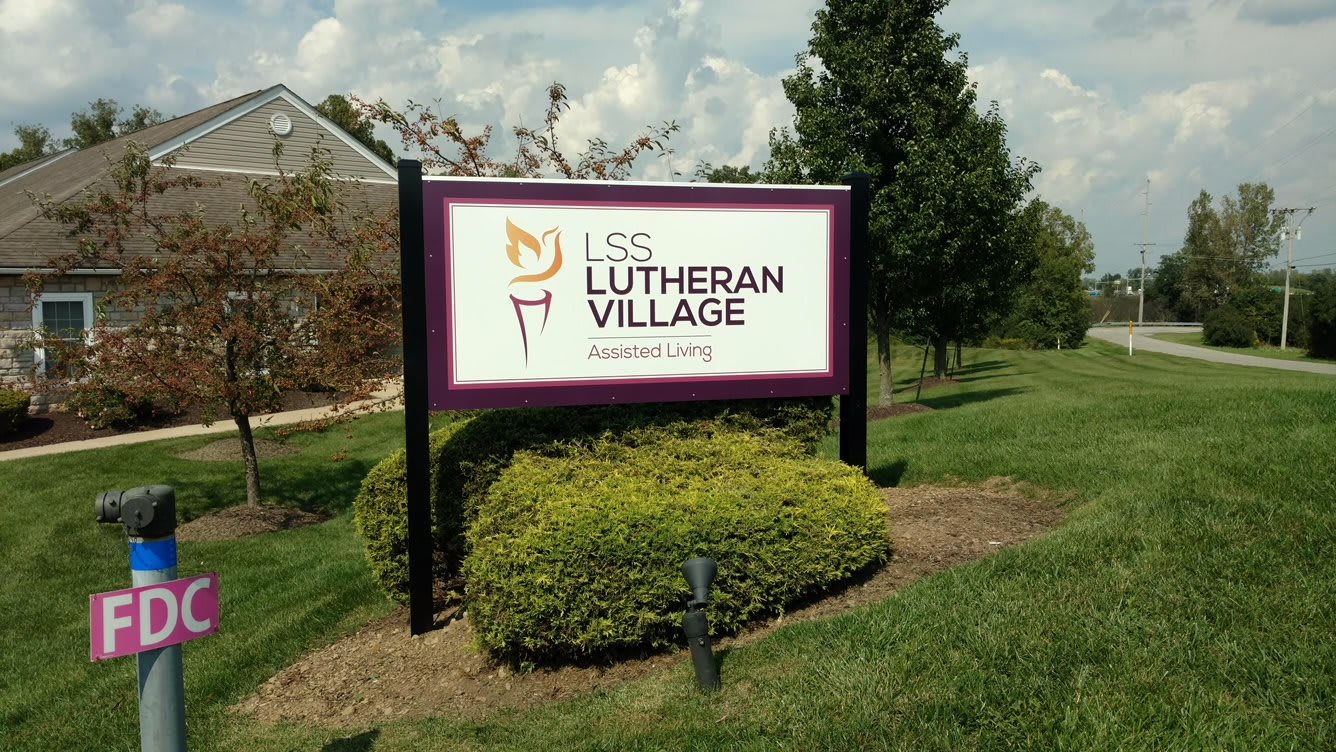
330 South Davis Road, Ashland, OH 44805 (1.5 mi from city center)Lutheran Village of Ashland is an assisted living community offering a continuum of care model that embraces all lifestyles and levels of care, allowing residents to enjoy maximum autonomy and independence in a home-like setting.

Brethren Care Village
2140 Center Street, Ashland, OH 44805 (1.6 mi from city center)Brethren Care Village is a Christian-based senior living community providing exceptional individualized care and services that address the whole person.
Map of Assisted Living in Ashland
Find the right senior living community by location- The Good Shepherd
- St. Martin Management
- The Inn at Ashland Woods
- Lutheran Village of Ashland
- Brethren Care Village
Senior Living Statistics for Ashland, Ohio
Average Senior Living Costs by Housing Type
If you're seeking senior living options in Ashland, Ohio, the cost for assisted living, memory care, and independent living is uniform, each averaging $4,301 per month. Nursing home care presents a range of costs depending on room type; a studio averages $4,679, while a semi-private room is slightly higher at $5,190 per month, and a private room costs $5,215. These options allow for various choices in care levels and budgetary preferences, catering to different needs while maintaining comfort and quality.
| Housing Type | Average Monthly Cost |
|---|---|
| Assisted Living | $4,301 |
| Memory Care | $4,301 |
| Independent Living | $4,301 |
| Nursing Home: Private Room | $5,215 |
| Nursing Home: Semi-Private Room | $5,190 |
| Nursing Home: Studio | $4,679 |
Average Cost of Assisted Living in Ashland
Assisted living costs an average of $4,301 per month in Ashland. This is more expensive than nearby cities, including New London ($4,076 per month) and Greenwich ($4,285 per month). Ashland remains below both the Ohio state average of $4,962 and the nationwide average of $4,546 per month.
| City | Average Monthly Cost |
|---|---|
| Ashland | $4,301 |
| New London | $4,076 |
| Greenwich | $4,285 |
Here is how the average cost of assisted living in Ashland compares to Ohio and the national average:
| Area | Average Monthly Cost |
|---|---|
| Ashland | $4,301 |
| Ohio | $4,962 |
| United States | $4,546 |
Senior Living Availability in Ashland
Ashland offers 5 of the 900 senior living communities in Ohio. If you decide to extend your search to the cities near Ashland, there are 5 facilities. With these options, you're sure to find a community that meets your needs perfectly.
Ashland
Surrounding Area
Ohio
Ashland Senior Demographics
In Ashland, Ohio, seniors make up nearly 39% of the 19,270 total residents. These seniors include 11% in their 50s, 12.7% in their 60s, 9.5% in their 70s, and 5.8% are 80 and older. The community's gender distribution skews slightly female, with women making up 51.5% of the population compared to 48.5% male. Regarding marital status, 44.6% of seniors are married, 13.8% are divorced, 34.1% have never married, and 7.4% are widowed. Ashland's diversity predominantly features 92.5% White residents, alongside 4.2% mixed race, 2.2% Hispanic, 1.7% Black, 0.9% Asian, 0.4% Native American, and 0.4% identifying as other, painting a primarily homogeneous but slightly varied cultural landscape.
Population
Ashland has a population of 19,270.- 48.5% Male
- 51.5% Female
Marital Status
- 44.6% Married
- 13.8% Divorced
- 34.1% Never Married
- 7.4% Widowed
Age
Seniors make up about 39% of the population.- 11% in their 50s
- 12.7% in their 60s
- 9.5% in their 70s
- 5.8% in their 80s
Diversity
- 92.5% White
- 1.7% Black
- 0.9% Asian
- 0.4% Native
- 0.4% Identifying as Other
- 4.2% Mixed Race
- 2.2% Hispanic

