Best Assisted Living Facilities in Lima, OH
Find local assisted living and retirement communities in the Lima, OH area.
If you're exploring senior living options in Lima, Ohio, you'll find a variety of communities geared towards meeting diverse needs. Lima hosts 11 senior living facilities, plus an additional 14 in the surrounding areas, providing options that range from independent and assisted living to memory care and nursing homes. With an average assisted living cost of $4,013 per month, Lima offers competitive pricing relative to state and national averages. To simplify your search for quality care, this guide will highlight premier assisted living options in Lima, helping you make an informed decision that best suits the lifestyle requirements for you or your loved ones.
- Bluffton, OH
- ,
- Adult Day Services
- Assisted Living
- Home Care
- Independent Living
- Memory Care
- Nursing Home
- Residential Care Home
- Senior Apartments
- Distance from City Center
- Highest Rating
- Name: A - Z
- Name: Z - A

Lima Apartments
760 E 4th St, Lima, OH 45804 (1.9 mi from city center)Lima Apartments is a 70-unit apartment community in Lima, Ohio, offering 1- and 2-bedroom apartments.
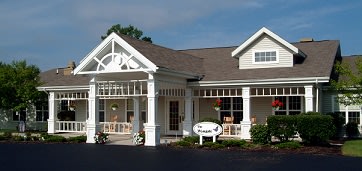
The Wyngate Senior Living Community (Lima)
1070 Gloria Avenue, Lima, OH 45805 (2.5 mi from city center)The Wyngate Senior Living Community in Lima, Ohio, offers assisted living and independent living services in a variety of lifestyle and residential options.
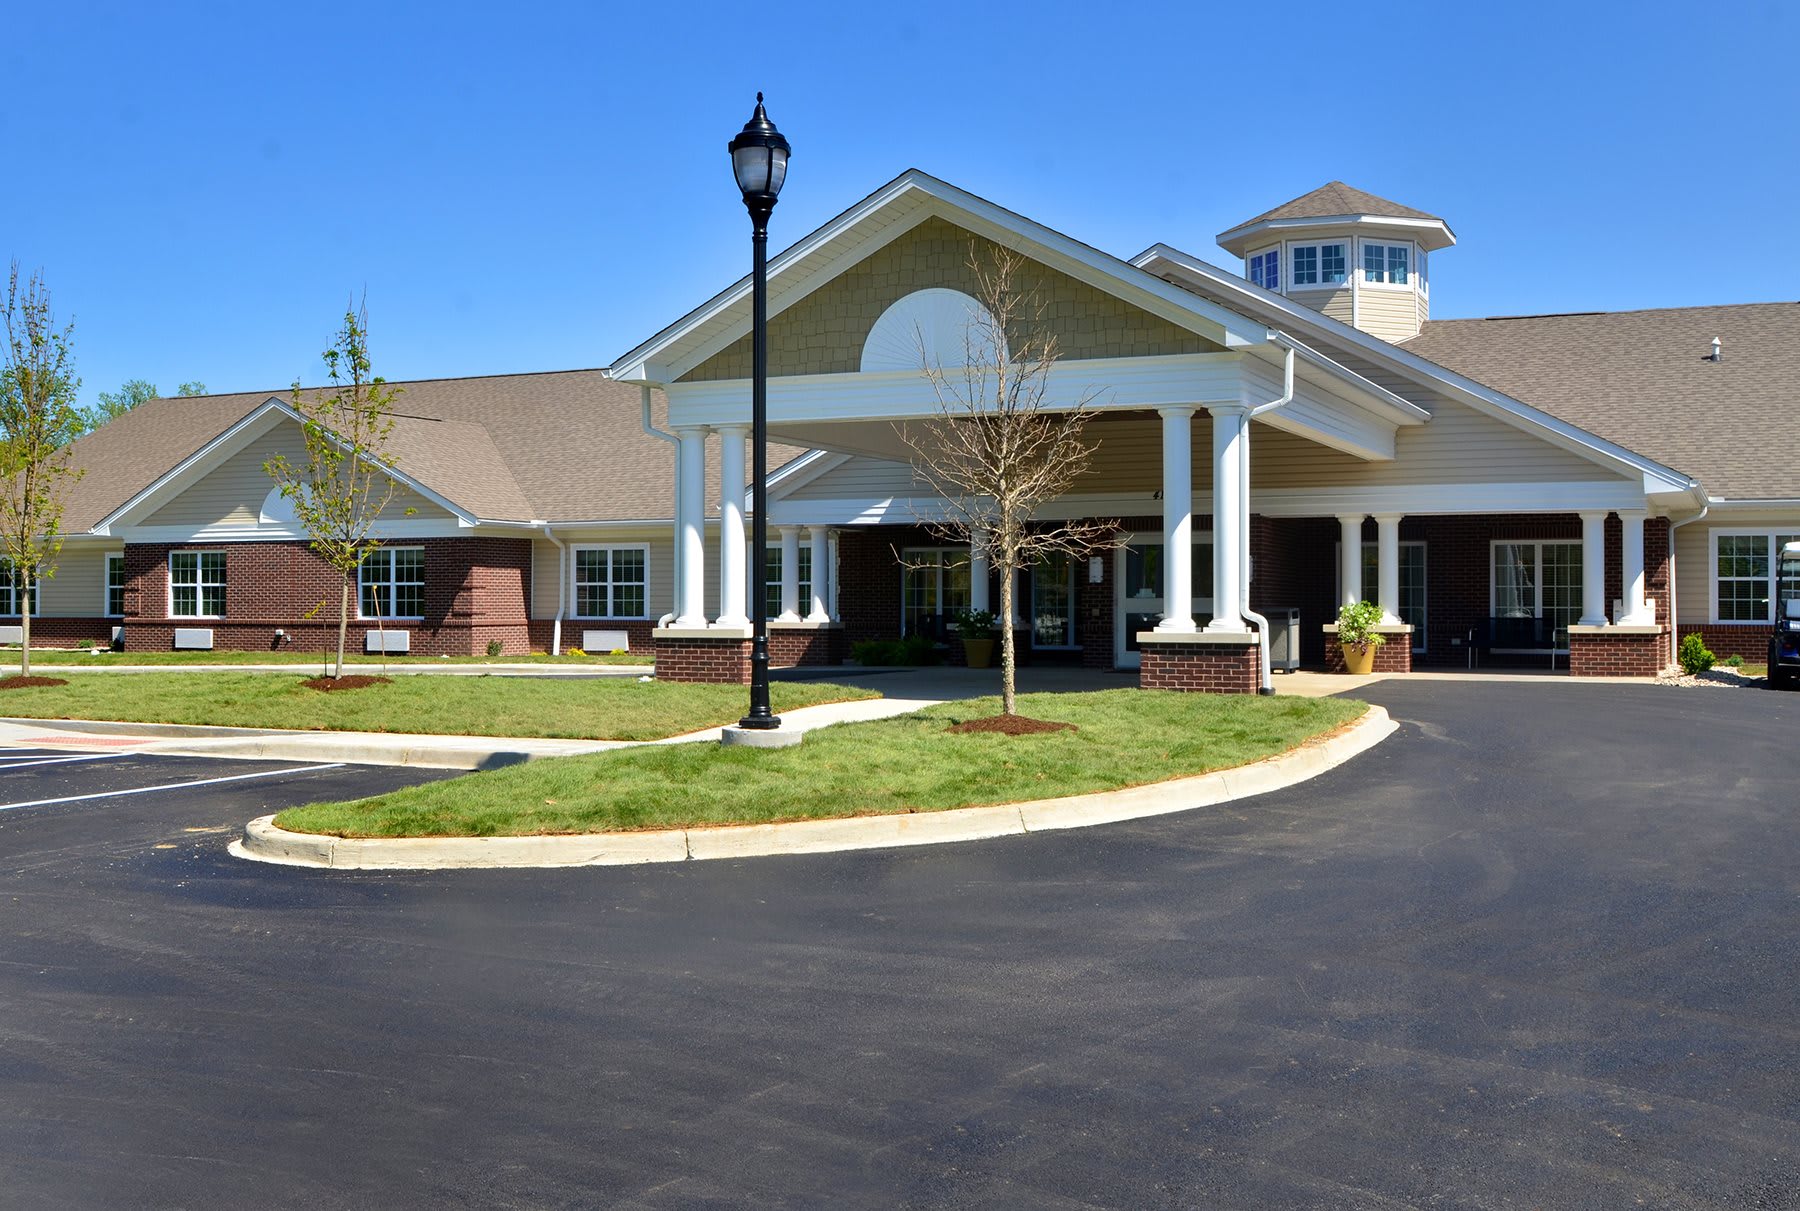
The Springs of Lima
370 N Eastown Rd, Lima, OH 45807 (2.8 mi from city center)The Springs of Lima is a senior living community offering assisted living, memory care, and skilled services in Lima, OH.
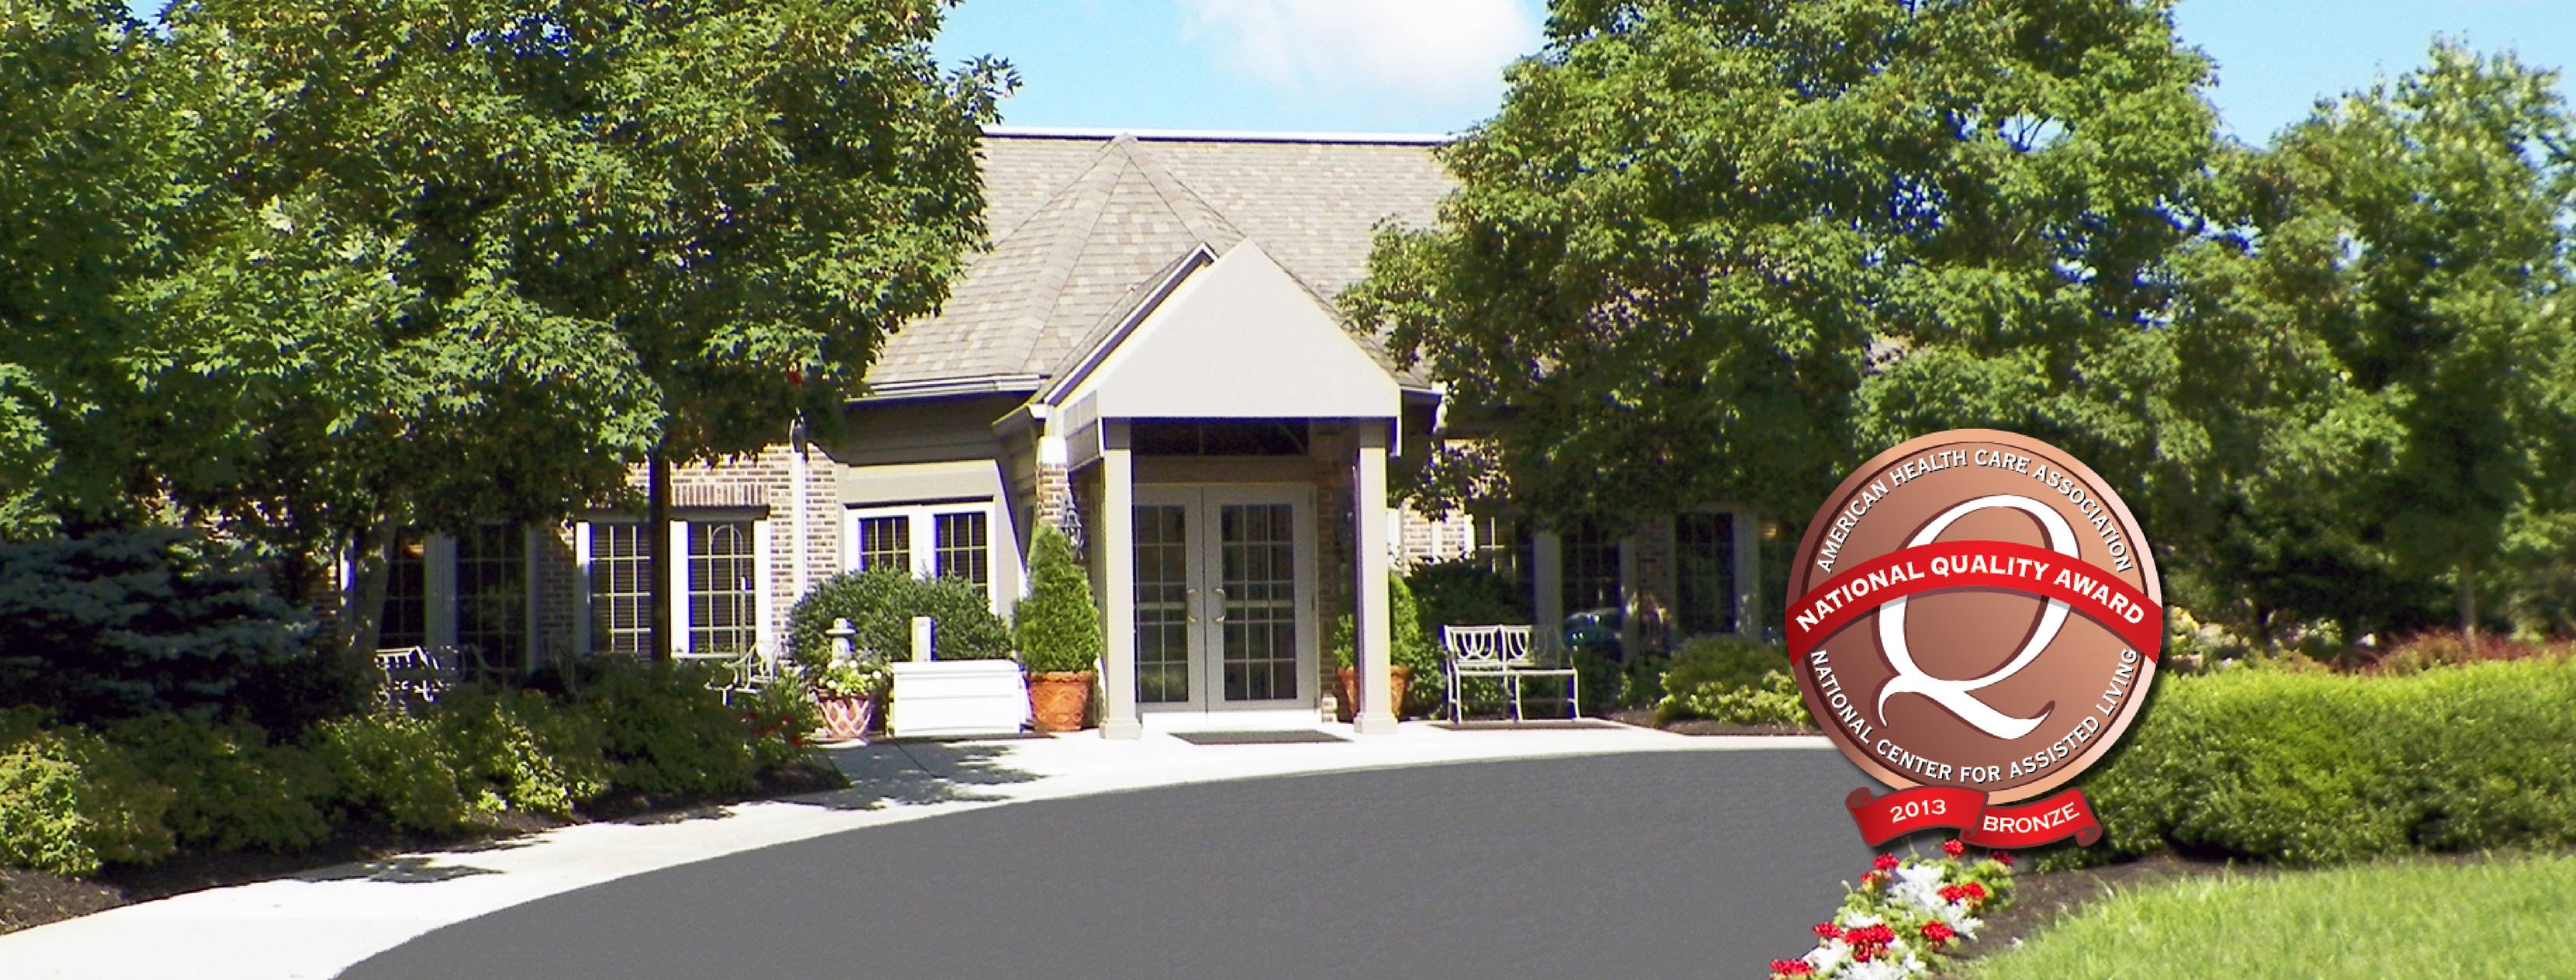
Burton's Ridge Assisted Living
2651 Fort Amanda Rd, Lima, OH 45804 (3.2 mi from city center)Burton's Ridge offers assisted living, independent living, and memory support services in a variety of living arrangements with personal care services, menu options, social activities, and amenities.
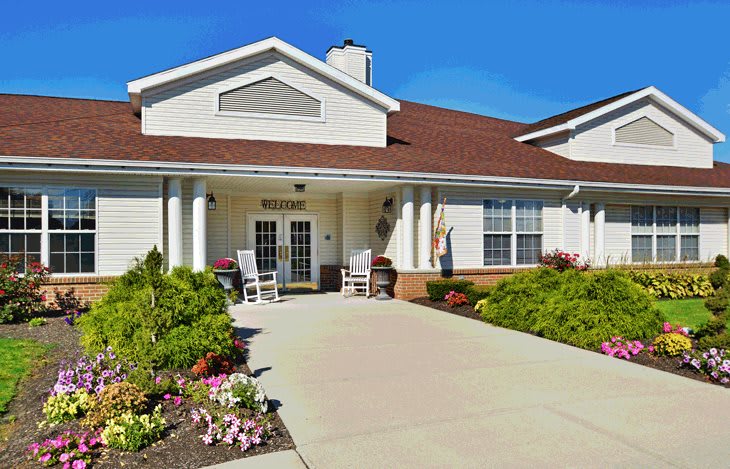
Kessler Estates Senior Living
2075 N Eastown Rd, Lima, OH 45807 (3.3 mi from city center)Kessler Estates Senior Living is a one-story community offering assisted living and memory care services in a homelike environment.

Luther Pines
805 S Mumaugh Rd, Lima, OH 45804 (4.4 mi from city center)Luther Pines is an attractive, affordable apartment community primarily for individuals age 62 years or older, offering independent living in Lima, OH.

The Meadows of Delphos
800 Ambrose Dr, Delphos, OH 45833 (13.1 mi from city center)The Meadows of Delphos is a senior living community offering assisted living, independent living, memory care, and skilled services.

Willow Ridge
101 Willow Ridge Drive, Bluffton, OH 45817 (15.1 mi from city center)Willow Ridge is an innovative senior living facility that provides assisted living, rehab and therapy, memory care, and long-term care/skilled nursing services in a comfortable environment focused on privacy, dignity, and individualized care.
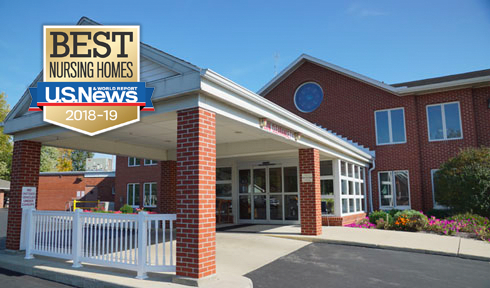
Mennonite Memorial Home
410 W Elm St, Bluffton, OH 45817 (15.8 mi from city center)Mennonite Memorial Home provides the whole continuum of care – from independent living villas and assisted living apartments to memory care and rehabilitation.
Map of Assisted Living in Lima
Find the right senior living community by location- Right at Home
- Springview Manor Nursing Home
- Home Instead - Lima, OH
- Lima Towers
- Furl Williams Apartments
- Lima Apartments
- The Wyngate Senior Living Community (Lima)
- The Springs of Lima
- Burton's Ridge Assisted Living
- Kessler Estates Senior Living
- Luther Pines
- The Meadows of Delphos
- Willow Ridge
- Mennonite Memorial Home
Senior Living Statistics for Lima, Ohio
Average Senior Living Costs by Housing Type
In Lima, Ohio, the most affordable option for senior housing is a nursing home one-bedroom unit, costing $3,772 per month on average. Independent living follows closely at $3,829 per month. Assisted living and memory care share the same price point of $4,013 per month, offering additional options for those needing more care. On the upper end, a nursing home studio is the most expensive, averaging $4,878 per month. Lima provides a diverse array of senior housing choices to accommodate different financial situations and care requirements.
| Housing Type | Average Monthly Cost |
|---|---|
| Assisted Living | $4,013 |
| Memory Care | $4,013 |
| Independent Living | $3,829 |
| Nursing Home: Private Room | $3,816 |
| Nursing Home: Semi-Private Room | $4,106 |
| Nursing Home: Studio | $4,878 |
| Nursing Home: One Bedroom | $3,772 |
Average Cost of Assisted Living in Lima
Compared to other cities in the area, Lima is slightly more expensive. For instance, Ottawa assisted living costs an average of $3,807 per month, and Pandora assisted living costs an average of $3,796 per month. On the flip side, Lima is less expensive than both the Ohio state average of $4,962 and the national average of $4,546 per month.
| City | Average Monthly Cost |
|---|---|
| Lima | $4,013 |
| Ottawa | $3,807 |
| Pandora | $3,796 |
Here is how the average cost of assisted living in Lima compares to Ohio and the national average:
| Area | Average Monthly Cost |
|---|---|
| Lima | $4,013 |
| Ohio | $4,962 |
| United States | $4,546 |
Senior Living Availability in Lima
There are currently 11 senior living facilities to choose from in Lima. Still considering where you or your loved one will settle? The surrounding area has 14 facilities to choose from, and there are a total of 900 facilities in the state of Ohio.
Lima
Surrounding Area
Ohio
Lima Senior Demographics
In Lima, Ohio, seniors account for about 31.7% of the city's population of 35,555. The senior population includes 11.2% in their 50s, 11.1% in their 60s, 5.9% in their 70s, and 3.5% who are 80 and over. The gender distribution leans slightly towards male, with 51.2% men compared to 48.8% women. Marital status among Lima's seniors shows that 29% are married, 18.5% are divorced, 45.8% have never married, and 6.7% are widowed. As for diversity, Lima's population is 64.7% White, 23.5% Black, with 9% identifying as mixed race. Additional representation includes 5.3% Hispanic, 2.5% identifying as other, 0.2% Asian, and 0.1% Native American, capturing the community's varied demographic landscape.
Population
Lima has a population of 35,555.- 51.2% Male
- 48.8% Female
Marital Status
- 29% Married
- 18.5% Divorced
- 45.8% Never Married
- 6.7% Widowed
Age
Seniors make up about 31.7% of the population.- 11.2% in their 50s
- 11.1% in their 60s
- 5.9% in their 70s
- 3.5% in their 80s
Diversity
- 64.7% White
- 23.5% Black
- 0.2% Asian
- 0.1% Native
- 2.5% Identifying as Other
- 9% Mixed Race
- 5.3% Hispanic
Additional Cities with Assisted Living Near Lima
If you're searching for senior housing near Lima, Ohio, Bluffton is a nearby option with an average cost of $3,813 per month. This provides a convenient and cost-effective choice for those in the Lima area looking at senior living communities.
