Best Assisted Living Facilities in Marietta, OH
Find local assisted living and retirement communities in the Marietta, OH area.
In Marietta, Ohio, where seniors make up a considerable 41% of the population, having access to quality senior living options is essential. The city is home to four senior living facilities, while the surrounding area offers an additional six options, providing a broad spectrum of care that includes assisted living, memory care, and independent living. With an average assisted living cost of $3,323 per month, Marietta presents affordable choices that cater to various lifestyles and needs. This guide will highlight some of the best-assisted living options available in Marietta, assisting you in making an informed decision to ensure the best possible care for your loved ones.
- Belpre, OH
- ,
- Adult Day Services
- Assisted Living
- Home Care
- Independent Living
- Memory Care
- Nursing Home
- Residential Care Home
- Senior Apartments
- Distance from City Center
- Highest Rating
- Name: A - Z
- Name: Z - A

Glenwood Community
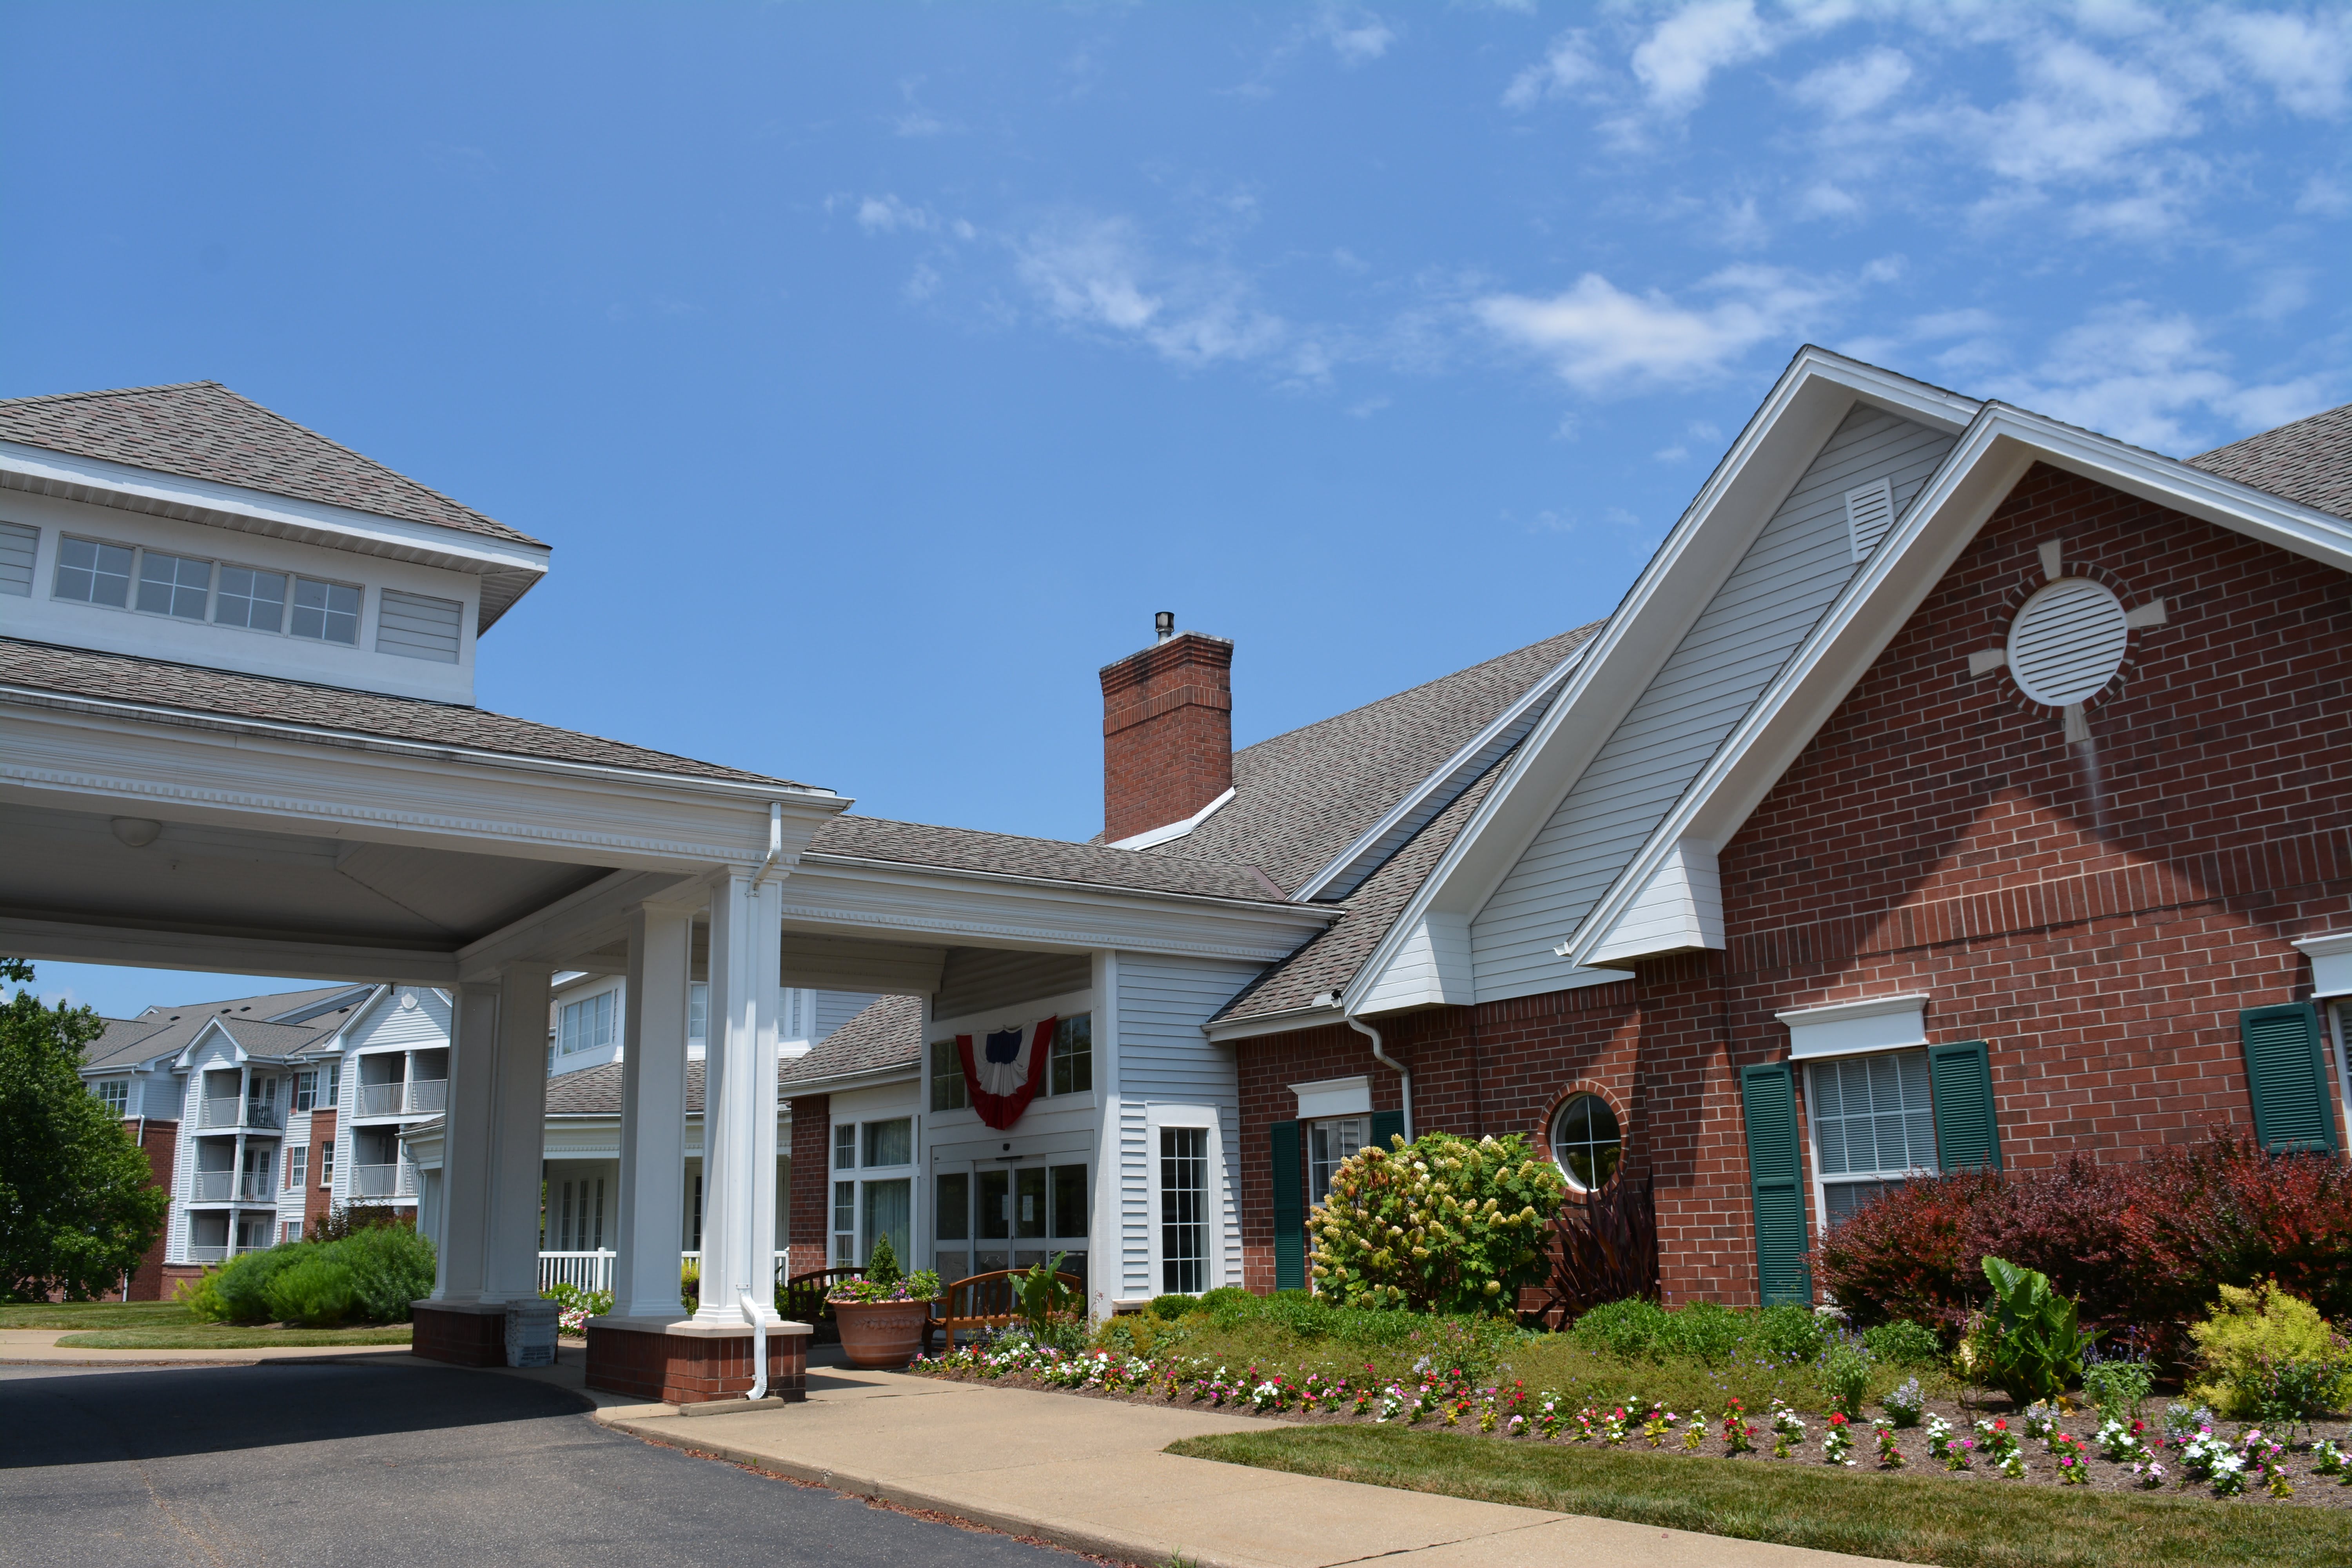
200 Timberline Dr, Marietta, OH 45750 (2.1 mi from city center)The Glenwood Community is a vibrant independent and assisted senior living community located on 70 wooded acres in historic Marietta, Ohio.

Hannas Home
1417 Lancaster St, Marietta, OH 45750 (2.7 mi from city center)Hannas Home is an assisted living facility located in Marietta, Ohio.

Elison of Marietta
150 Browns Rd, Marietta, OH 45750 (4 mi from city center)Elison Assisted Living & Memory Care of Marietta is a senior living community offering assisted living and memory care services.

Putnam Howe Village
711 Belrock Ave, Belpre, OH 45714 (12.7 mi from city center)Putnam Howe Village offers an affordable rental community for seniors age 62+ with one-bedroom floor plans and various amenities.

Muskingum Valley Nursing and Rehab
501 Pinecrest Dr, Beverly, OH 45715 (13.2 mi from city center)Muskingum Valley Nursing and Rehab is a skilled nursing and rehabilitation facility with a reputation for exceptional care and customer service.
Map of Assisted Living in Marietta
Find the right senior living community by location- Comfort Keepers
- Glenwood Community
- Hannas Home
- Elison of Marietta
- Putnam Howe Village
- Muskingum Valley Nursing and Rehab
Senior Living Statistics for Marietta, Ohio
Average Senior Living Costs by Housing Type
In Marietta, Ohio, senior living expenses vary, catering to different needs and preferences. The most affordable option is a two-bedroom nursing home unit, averaging $2,263 per month. Independent living is also budget-friendly at $2,974 per month, offering greater autonomy. Assisted living and memory care share the same average cost of $3,323 monthly, providing supportive and specialized care options. For nursing home accommodations, a one-bedroom unit is priced at $3,316, while a semi-private room comes in at $3,545. A nursing home studio costs $4,399, and a private room is available for $4,599 per month. With such a wide array of options, seniors in Marietta can find a living arrangement that best suits their individual care needs and lifestyle preferences.
| Housing Type | Average Monthly Cost |
|---|---|
| Assisted Living | $3,323 |
| Memory Care | $3,323 |
| Independent Living | $2,974 |
| Nursing Home: Private Room | $4,599 |
| Nursing Home: Semi-Private Room | $3,545 |
| Nursing Home: Studio | $4,399 |
| Nursing Home: One Bedroom | $3,316 |
| Nursing Home: Two Bedroom | $2,263 |
Average Cost of Assisted Living in Marietta
Compared to nearby cities, assisted living in Marietta is relatively affordable. Caldwell offers an average monthly cost of $3,151, while Summerfield comes in at $3,203. Marietta, at $3,323, remains well below the Ohio state average of $4,962 and significantly cheaper than the national average of $4,546.
| City | Average Monthly Cost |
|---|---|
| Marietta | $3,323 |
| Caldwell | $3,151 |
| Summerfield | $3,203 |
Here is how the average cost of assisted living in Marietta compares to Ohio and the national average:
| Area | Average Monthly Cost |
|---|---|
| Marietta | $3,323 |
| Ohio | $4,962 |
| United States | $4,546 |
Senior Living Availability in Marietta
Marietta residents have 4 senior living facilities to choose from. In the surrounding area, there are 6 additional communities, and throughout the state of Ohio, a total of 900 facilities are available, providing a wide range of options for different needs and preferences.
Marietta
Surrounding Area
Ohio
Marietta Senior Demographics
In Marietta, Ohio, seniors represent a prominent 41% of the total population of 13,366, bringing a wealth of knowledge and cultural richness to the community. This senior demographic includes 11% in their 50s, 13.7% in their 60s, 9.2% in their 70s, and 7.1% who are 80 and older. The population balance is almost even between genders, with 49.6% male and 50.4% female residents. As for marital status, 36.5% of the seniors are married, 18.2% are divorced, 35.1% have never been married, and 10.2% are widowed. The senior population is predominantly White at 93.2%, with smaller segments including 2.3% Black, 1.6% Asian, and 2.5% identifying as mixed race, along with 2% Hispanic, reflecting a multifaceted community in Marietta.
Population
Marietta has a population of 13,366.- 49.6% Male
- 50.4% Female
Marital Status
- 36.5% Married
- 18.2% Divorced
- 35.1% Never Married
- 10.2% Widowed
Age
Seniors make up about 41% of the population.- 11% in their 50s
- 13.7% in their 60s
- 9.2% in their 70s
- 7.1% in their 80s
Diversity
- 93.2% White
- 2.3% Black
- 1.6% Asian
- 0.1% Native
- 0.4% Identifying as Other
- 2.5% Mixed Race
- 2% Hispanic
Additional Cities with Assisted Living Near Marietta
Several neighboring cities offer senior living options at different price points around Marietta, Ohio. In nearby Belpre, you can find senior housing prices averaging as low as $3,323 per month, providing a cost-effective option for those considering this area. While the selection nearby is limited, this option is a suitable choice for those seeking affordable senior housing.

