Best Assisted Living Facilities in Zanesville, OH
Find local assisted living and retirement communities in the Zanesville, OH area.
In Zanesville, Ohio, seniors account for about 36.1% of the population, which brings a compelling demand for a variety of senior living arrangements. Offering five senior living facilities within the city itself and an additional six in the surrounding areas, Zanesville provides options that include assisted living, memory care, and independent living. Assisted living in Zanesville averages $3,260 per month, making it an economical choice compared with state and national averages. This guide will explore the top assisted living facilities in Zanesville, focusing on those that provide excellent care and amenities, so you can confidently select the ideal environment for your loved ones.
- Adult Day Services
- Assisted Living
- Home Care
- Independent Living
- Memory Care
- Nursing Home
- Residential Care Home
- Senior Apartments
- Distance from City Center
- Highest Rating
- Name: A - Z
- Name: Z - A

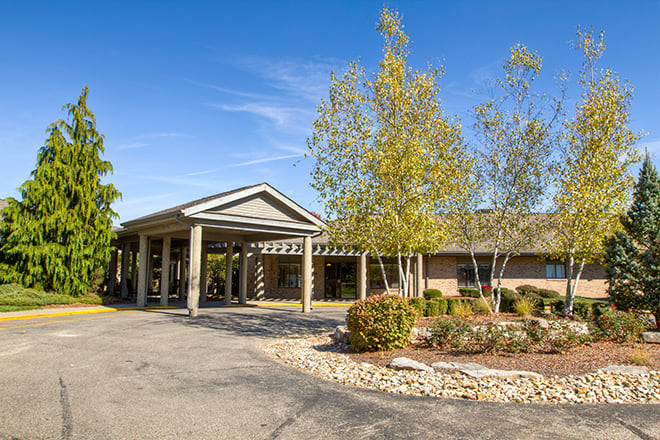
Brookdale Zanesville
1575 Bowers Lane, Zanesville, OH 43701 (2.2 mi from city center)Brookdale Zanesville offers exceptional assisted living and memory care services on six beautifully landscaped acres.

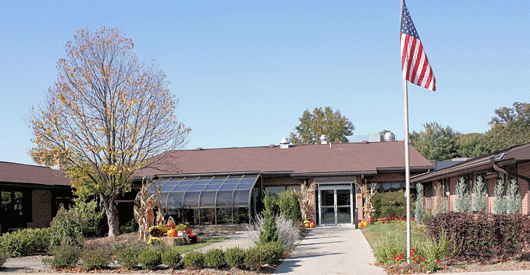
The Oaks at Northpointe
3291 Northpointe Dr, Zanesville, OH 43701 (2.5 mi from city center)The Oaks at Northpointe offers Assisted Living and Memory Care suites to Seniors, along with Post-Acute Healthcare Services.

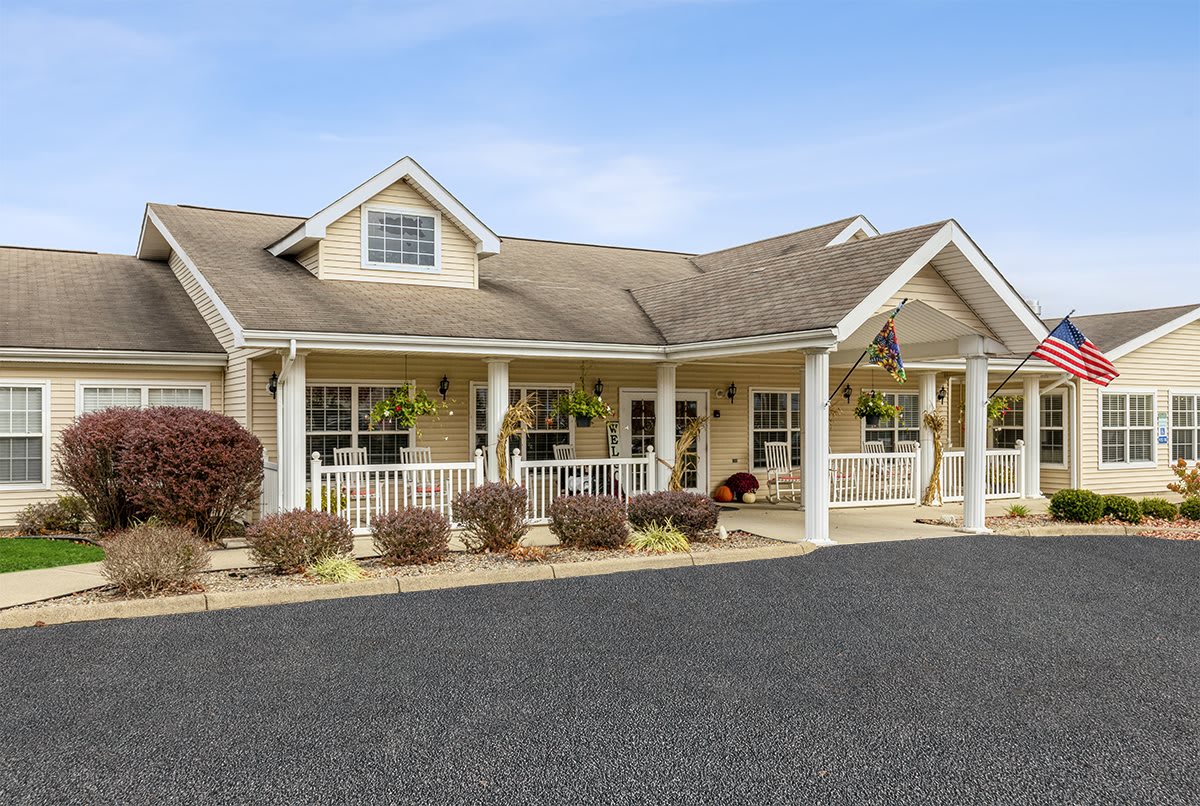
Clay Gardens Place
3784 Frazeysburg Rd., Zanesville, OH 43701 (2.8 mi from city center)Clay Gardens Place is a small, homelike senior living community offering assisted living and respite care in Zanesville, Ohio.

Primrose Retirement Communities
4212 Northpointe Dr, Zanesville, OH 43701 (3.2 mi from city center)Primrose Retirement Communities offers senior living options including independent living, assisted living, and townhome villas with various amenities and services.

Beckett House
1280 Friendship Dr, New Concord, OH 43762 (14.7 mi from city center)Beckett House at New Concord is a Senior Living provider in New Concord, Ohio that offers residents Continuing Care Communities and Nursing Homes services.
Map of Assisted Living in Zanesville
Find the right senior living community by location- Abbot Senior Living
- Brookdale Zanesville
- The Oaks at Northpointe
- Clay Gardens Place
- Primrose Retirement Communities
- Beckett House
Senior Living Statistics for Zanesville, Ohio
Average Senior Living Costs by Housing Type
The most affordable option for senior housing in Zanesville, Ohio, is independent living, which averages $2,421 per month. For slightly higher costs, assisted living is available at $3,260 per month, while memory care averages a bit less at $3,207. Those considering nursing home accommodations will find a range of choices. A semi-private room is the budget-friendly option, costing $1,581 per month, whereas a studio goes for $3,246. A private room is on the higher side, averaging $3,535 per month.
| Housing Type | Average Monthly Cost |
|---|---|
| Assisted Living | $3,260 |
| Memory Care | $3,207 |
| Independent Living | $2,421 |
| Nursing Home: Private Room | $3,535 |
| Nursing Home: Semi-Private Room | $1,581 |
| Nursing Home: Studio | $3,246 |
Average Cost of Assisted Living in Zanesville
The average cost of assisted living is $3,260 per month in Zanesville. This is slightly more expensive than other nearby cities, including Roseville and South Zanesville, which cost an average of $3,224 and $3,215 per month, respectively. Zanesville's costs are significantly lower than both the Ohio state average of $4,962 and the nationwide average of $4,546 per month.
| City | Average Monthly Cost |
|---|---|
| Zanesville | $3,260 |
| Roseville | $3,224 |
| South Zanesville | $3,215 |
Here is how the average cost of assisted living in Zanesville compares to Ohio and the national average:
| Area | Average Monthly Cost |
|---|---|
| Zanesville | $3,260 |
| Ohio | $4,962 |
| United States | $4,546 |
Senior Living Availability in Zanesville
Still deciding if an assisted living community in Zanesville, Ohio, is right for you? There are plenty of options in and around the city. Zanesville has 5 senior living facilities, the surrounding area has 6, and the state of Ohio has 900.
Zanesville
Surrounding Area
Ohio
Zanesville Senior Demographics
In Zanesville, Ohio, seniors constitute a significant 36.1% of the total 24,772 residents. Gender distribution slightly favors females, who make up 52.6% of the population compared to 47.4% males. Among the senior age groups, 12.5% are in their 50s, 10.9% in their 60s, 7.4% in their 70s, and 5.3% are 80 and above. Regarding marital status, 31.1% of seniors are married, 21.4% are divorced, 39.8% have never been married, and 7.7% are widowed. Zanesville displays some diversity with 80.9% identifying as White, 8.8% as Black, 1.3% as Asian, a small percentage of Native American, 7.9% as mixed race, and 2.9% Hispanic, all adding unique elements to the city's demographic landscape.
Population
Zanesville has a population of 24,772.- 47.4% Male
- 52.6% Female
Marital Status
- 31.1% Married
- 21.4% Divorced
- 39.8% Never Married
- 7.7% Widowed
Age
Seniors make up about 36.1% of the population.- 12.5% in their 50s
- 10.9% in their 60s
- 7.4% in their 70s
- 5.3% in their 80s
Diversity
- 80.9% White
- 8.8% Black
- 1.3% Asian
- 0.1% Native
- 1% Identifying as Other
- 7.9% Mixed Race
- 2.9% Hispanic

