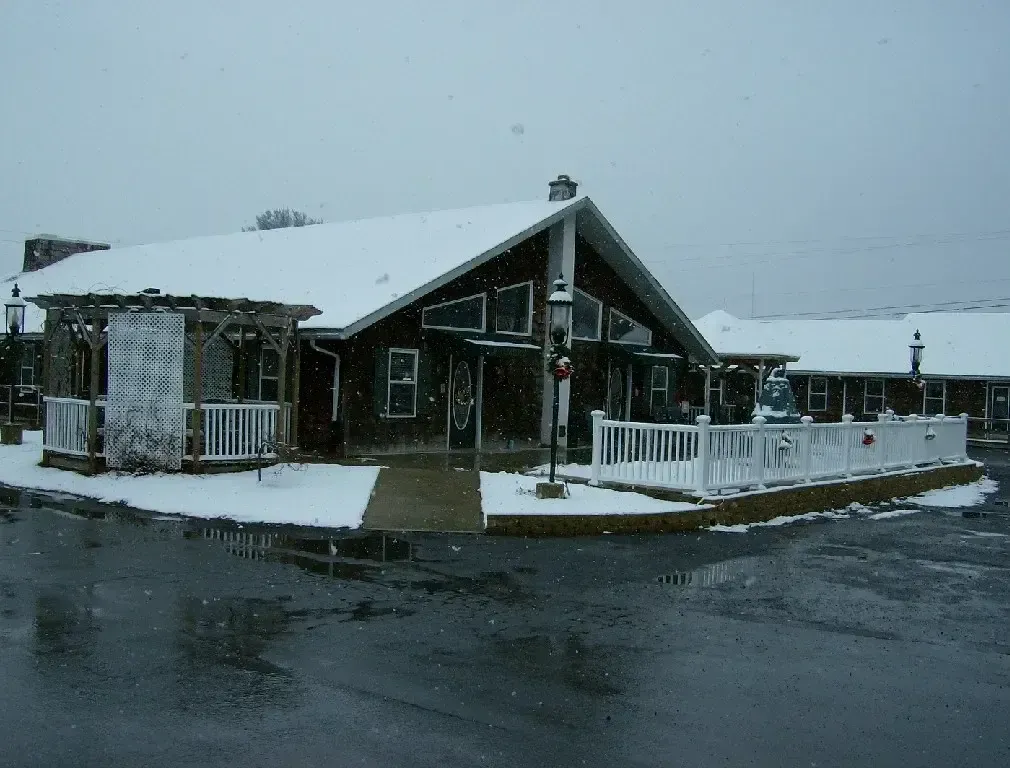
Best Assisted Living Facilities in Lock Haven, PA
Find local assisted living and retirement communities in the Lock Haven, PA area.
Lock Haven is home to 4 senior living facilities, offering options from independent living and assisted living to nursing homes and memory care. Since 26.4% of the town's population are seniors, there is a significant need for quality care, and we understand how important it is to find the right fit for your needs. In this article, we will cover the best senior living facilities in Lock Haven so you can find the right place for your loved one to live out their golden years.
- Adult Day Services
- Assisted Living
- Home Care
- Independent Living
- Memory Care
- Nursing Home
- Residential Care Home
- Respite Care
- Senior Apartments
- Distance from City Center
- Highest Rating
- Name: A - Z
- Name: Z - A

Susque-View Home Inc
22 Cree Dr, Lock Haven, PA 17745 (0.9 mi from city center)Susque-View Home Inc offers a range of care options including skilled nursing care, short-term rehabilitation, respite care, hospice care, and independent living.

Fulmer's Personal Care Home
201 Woodward Ave, Lock Haven, PA 17745 (1.6 mi from city center)Fulmer's Personal Care Home is a family-owned and operated assisted living facility providing personalized care, healthy interaction, respectful supervision, and daily services such as meal preparation, hygiene, cleaning, and supervision.
Map of Assisted Living in Lock Haven
Find the right senior living community by location- Moriarty Court
- Kephart Plaza
- Susque-View Home Inc
- Fulmer's Personal Care Home
Senior Living Statistics for Lock Haven, Pennsylvania
Average Senior Living Costs by Housing Type
Assisted living is the least expensive type of senior living in Lock Haven, Pennsylvania, starting at $3,602 per month. The most costly type is a one-bedroom unit in a nursing home, which averages $5,406 per month. There are several other options at various price points, including memory care at $5,394 per month and independent living at $3,874 per month.
| Housing Type | Average Monthly Cost |
|---|---|
| Assisted Living | $3,602 |
| Memory Care | $5,394 |
| Independent Living | $3,874 |
| Nursing Home: Private Room | $3,931 |
| Nursing Home: Semi-Private Room | $3,102 |
| Nursing Home: Studio | $4,759 |
| Nursing Home: One Bedroom | $5,406 |
Average Cost of Assisted Living in Lock Haven
The average cost of assisted living communities in Lock Haven is 3602 per month. For comparison, nearby cities Renovo and South Renovo cost $2,336 per month. Lock Haven is more affordable than the state average in Pennsylvania ($4,271) and the nationwide average of $4,546 per month.
| City | Average Monthly Cost |
|---|---|
| Lock Haven | $3,602 |
| Renovo | $2,336 |
| South Renovo | $2,336 |
Here is how the average cost of assisted living in Lock Haven compares to Pennsylvania and the national average:
| Area | Average Monthly Cost |
|---|---|
| Lock Haven | $3,602 |
| Pennsylvania | $4,271 |
| United States | $4,546 |
Senior Living Availability in Lock Haven
If you don't find the senior living option that's right for you in Lock Haven, there are still choices available in the surrounding area. With 4 facilities in nearby regions and a total of 918 facilities within the whole of Pennsylvania, you'll have plenty of options to consider.
Lock Haven
Surrounding Area
Pennsylvania
Lock Haven Senior Demographics
Seniors constitute about 26.4% of the population in Lock Haven. Of the residents, 47.8% are male and 52.2% are female. Age-wise, 8.5% are in their 50s, 8.6% in their 60s, 4.7% in their 70s, and 4.6% over 80. Marital status shows 29.3% are married, 11% divorced, 52.4% never married, and 7.3% widowed. The community's composition is predominantly 89.8% White, with a presence of 4.3% Black, and 2.9% Hispanic residents.
Population
Lock Haven has a population of 8,386.- 47.8% Male
- 52.2% Female
Marital Status
- 29.3% Married
- 11% Divorced
- 52.4% Never Married
- 7.3% Widowed
Age
Seniors make up about 26.4% of the population.- 8.5% in their 50s
- 8.6% in their 60s
- 4.7% in their 70s
- 4.6% in their 80s
Diversity
- 89.8% White
- 4.3% Black
- 1.2% Asian
- 0.5% Native
- 0.4% Identifying as Other
- 3.7% Mixed Race
- 2.9% Hispanic


