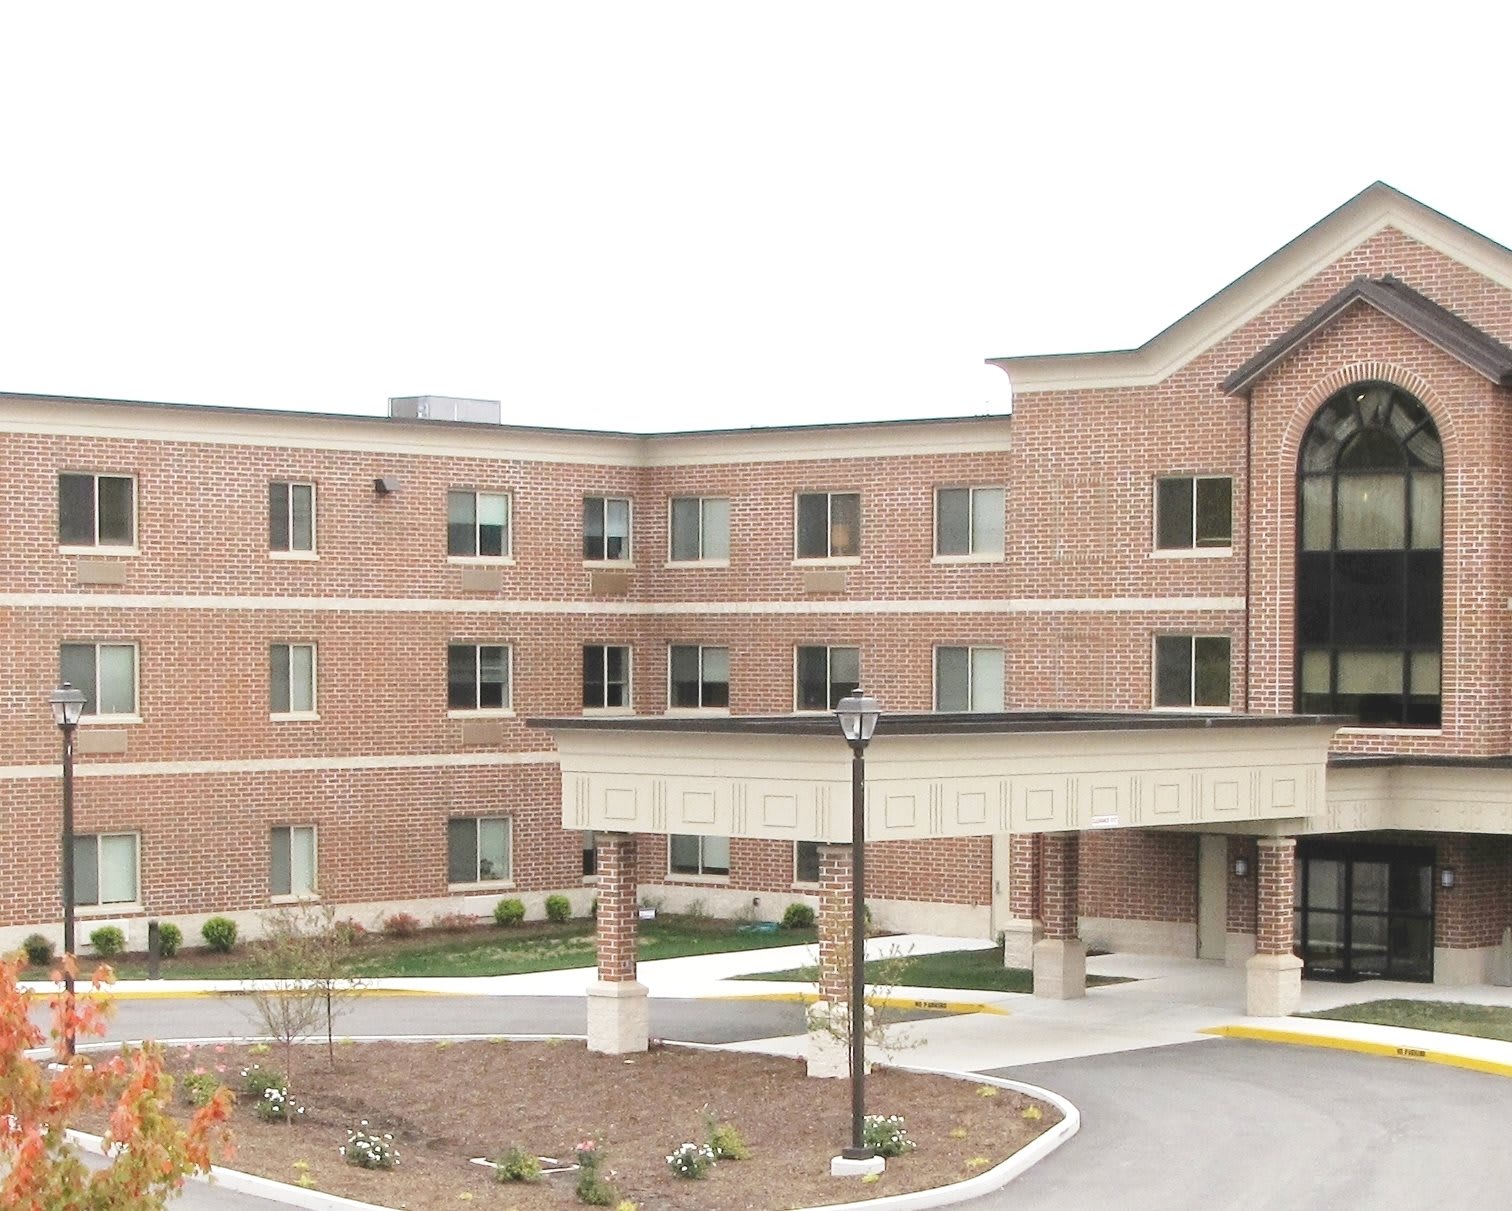
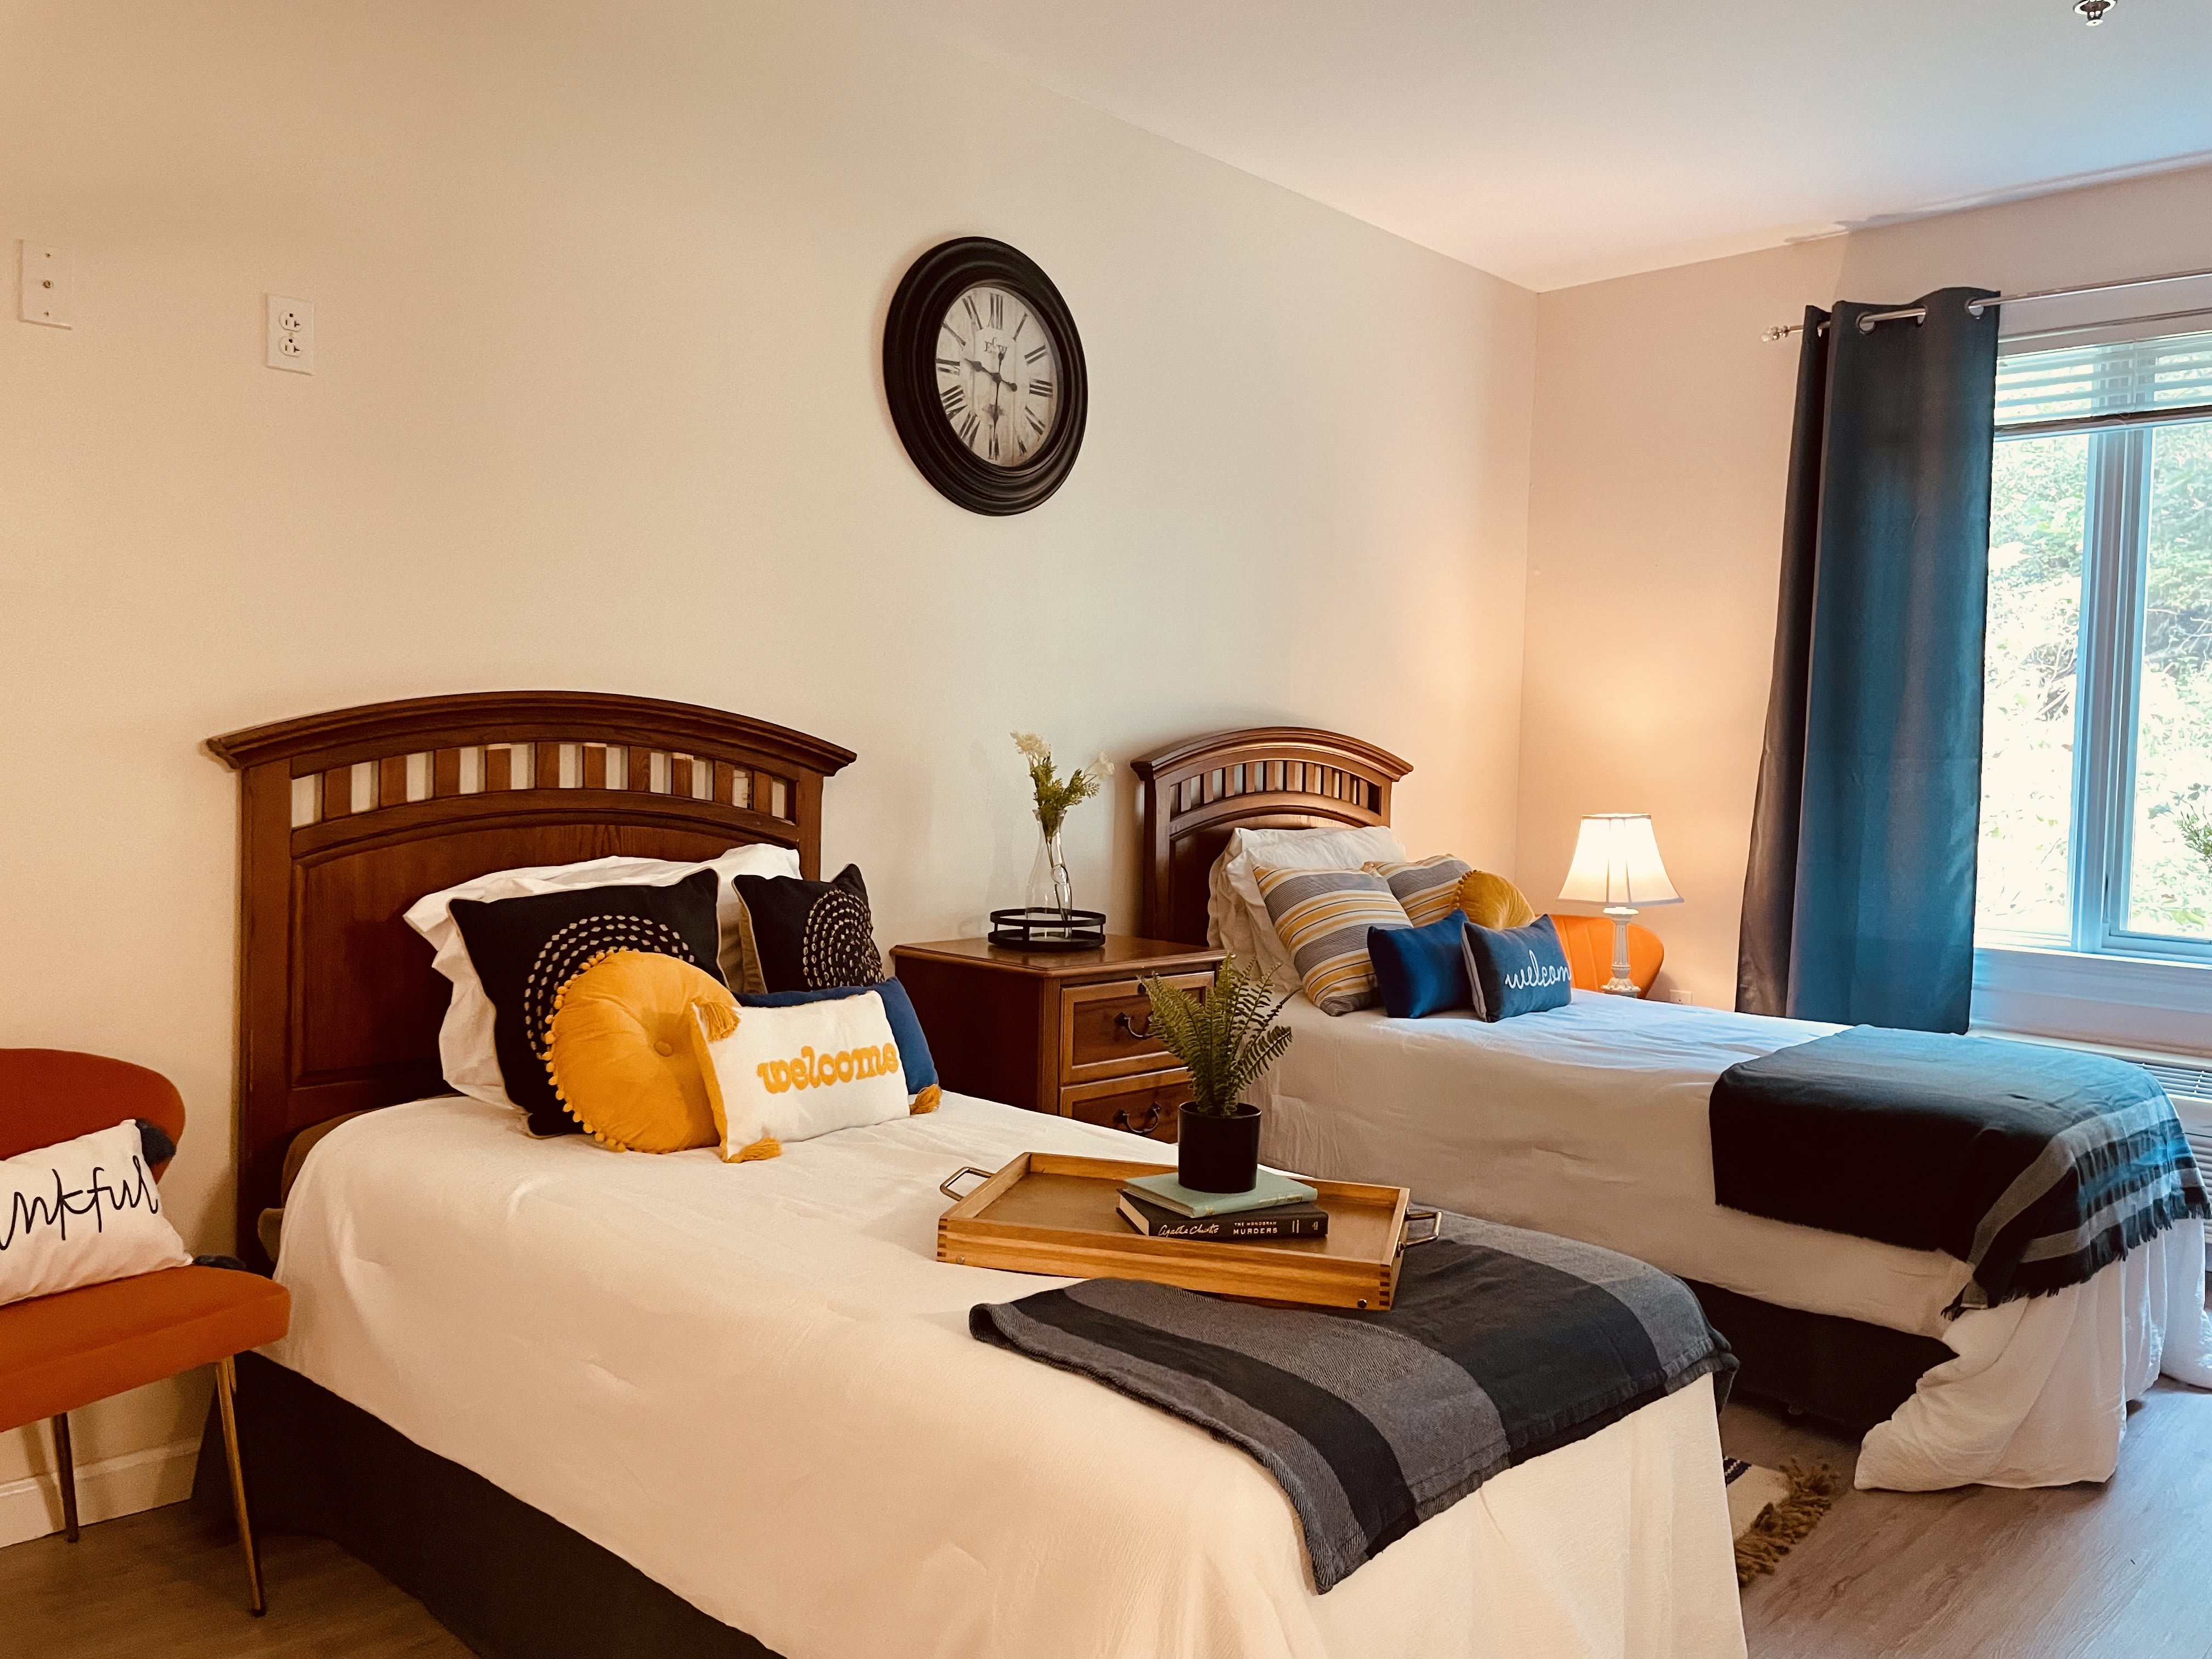
Best Assisted Living Facilities in Lower Burrell, PA
Find local assisted living and retirement communities in the Lower Burrell, PA area.
45.9% of Lower Burrell residents are seniors, with a variety of independent living, assisted living, memory care, and nursing facilities available to meet their needs. Considering senior living can be challenging, whether it's for yourself or a loved one. The aim of this guide is to simplify that decision by highlighting the assisted living communities that offer the best care and amenities.
- Pittsburgh, PA
- Greensburg, PA
- Bethel Park, PA
- Monroeville, PA
- New Castle, PA
- Uniontown, PA
- Latrobe, PA
- Bridgeville, PA
- Mars, PA
- Wexford, PA
- Penn Hills, PA
- North Huntingdon, PA
- Munhall, PA
- North Versailles, PA
- Beaver Falls, PA
- Jeannette, PA
- Oakmont, PA
- Mckees Rocks, PA
- Adult Day Services
- Assisted Living
- Home Care
- Independent Living
- Memory Care
- Nursing Home
- Residential Care Home
- Respite Care
- Senior Apartments
- Distance from City Center
- Highest Rating
- Name: A - Z
- Name: Z - A
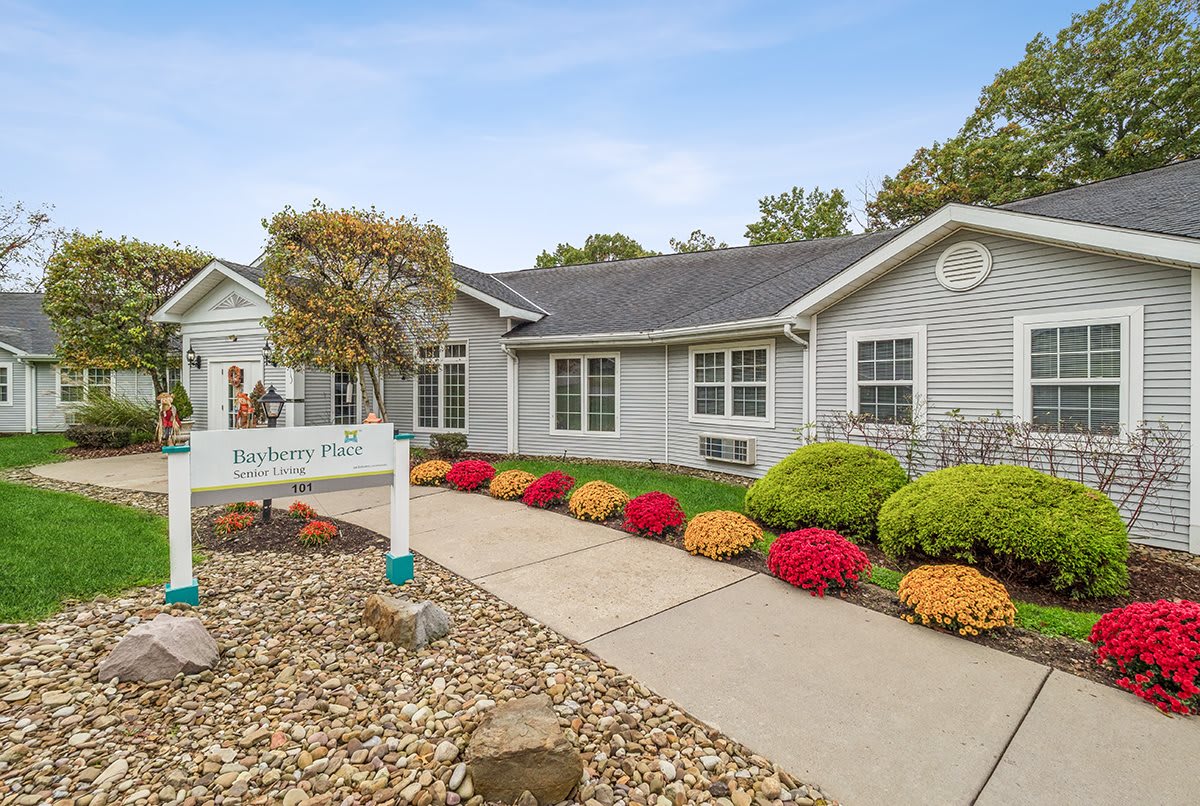
Bayberry Place
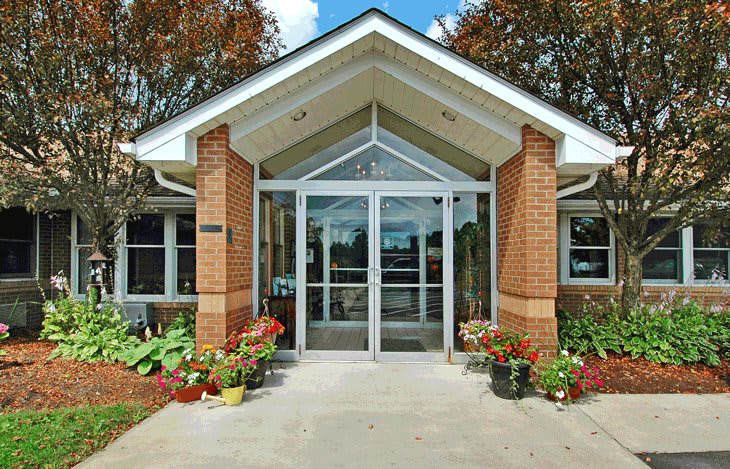
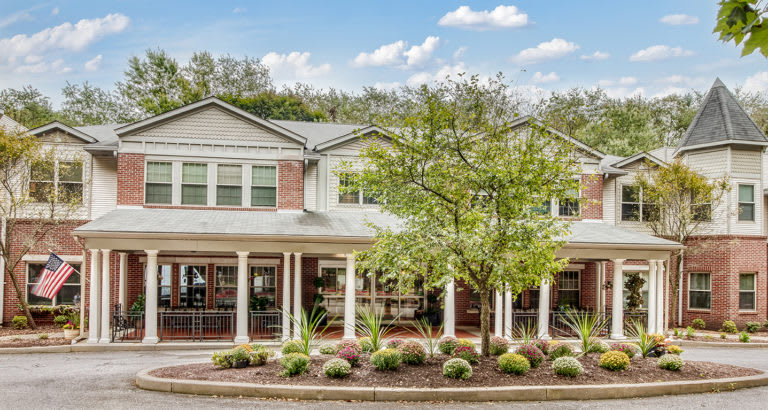
101 Little Rd, Lower Burrell, PA 15068 (0.6 mi from city center)Bayberry Place is an assisted living facility in Lower Burrell, Pennsylvania, offering compassionate care in a small neighborhood setting.

Westarm Therapy & Homecare
2757 Leechburg Road, Lower Burrell, PA 15068 (1.3 mi from city center)Westarm Therapy & Homecare provides home health services including physical therapy, occupational therapy, speech therapy, skilled nursing, and home health aides.
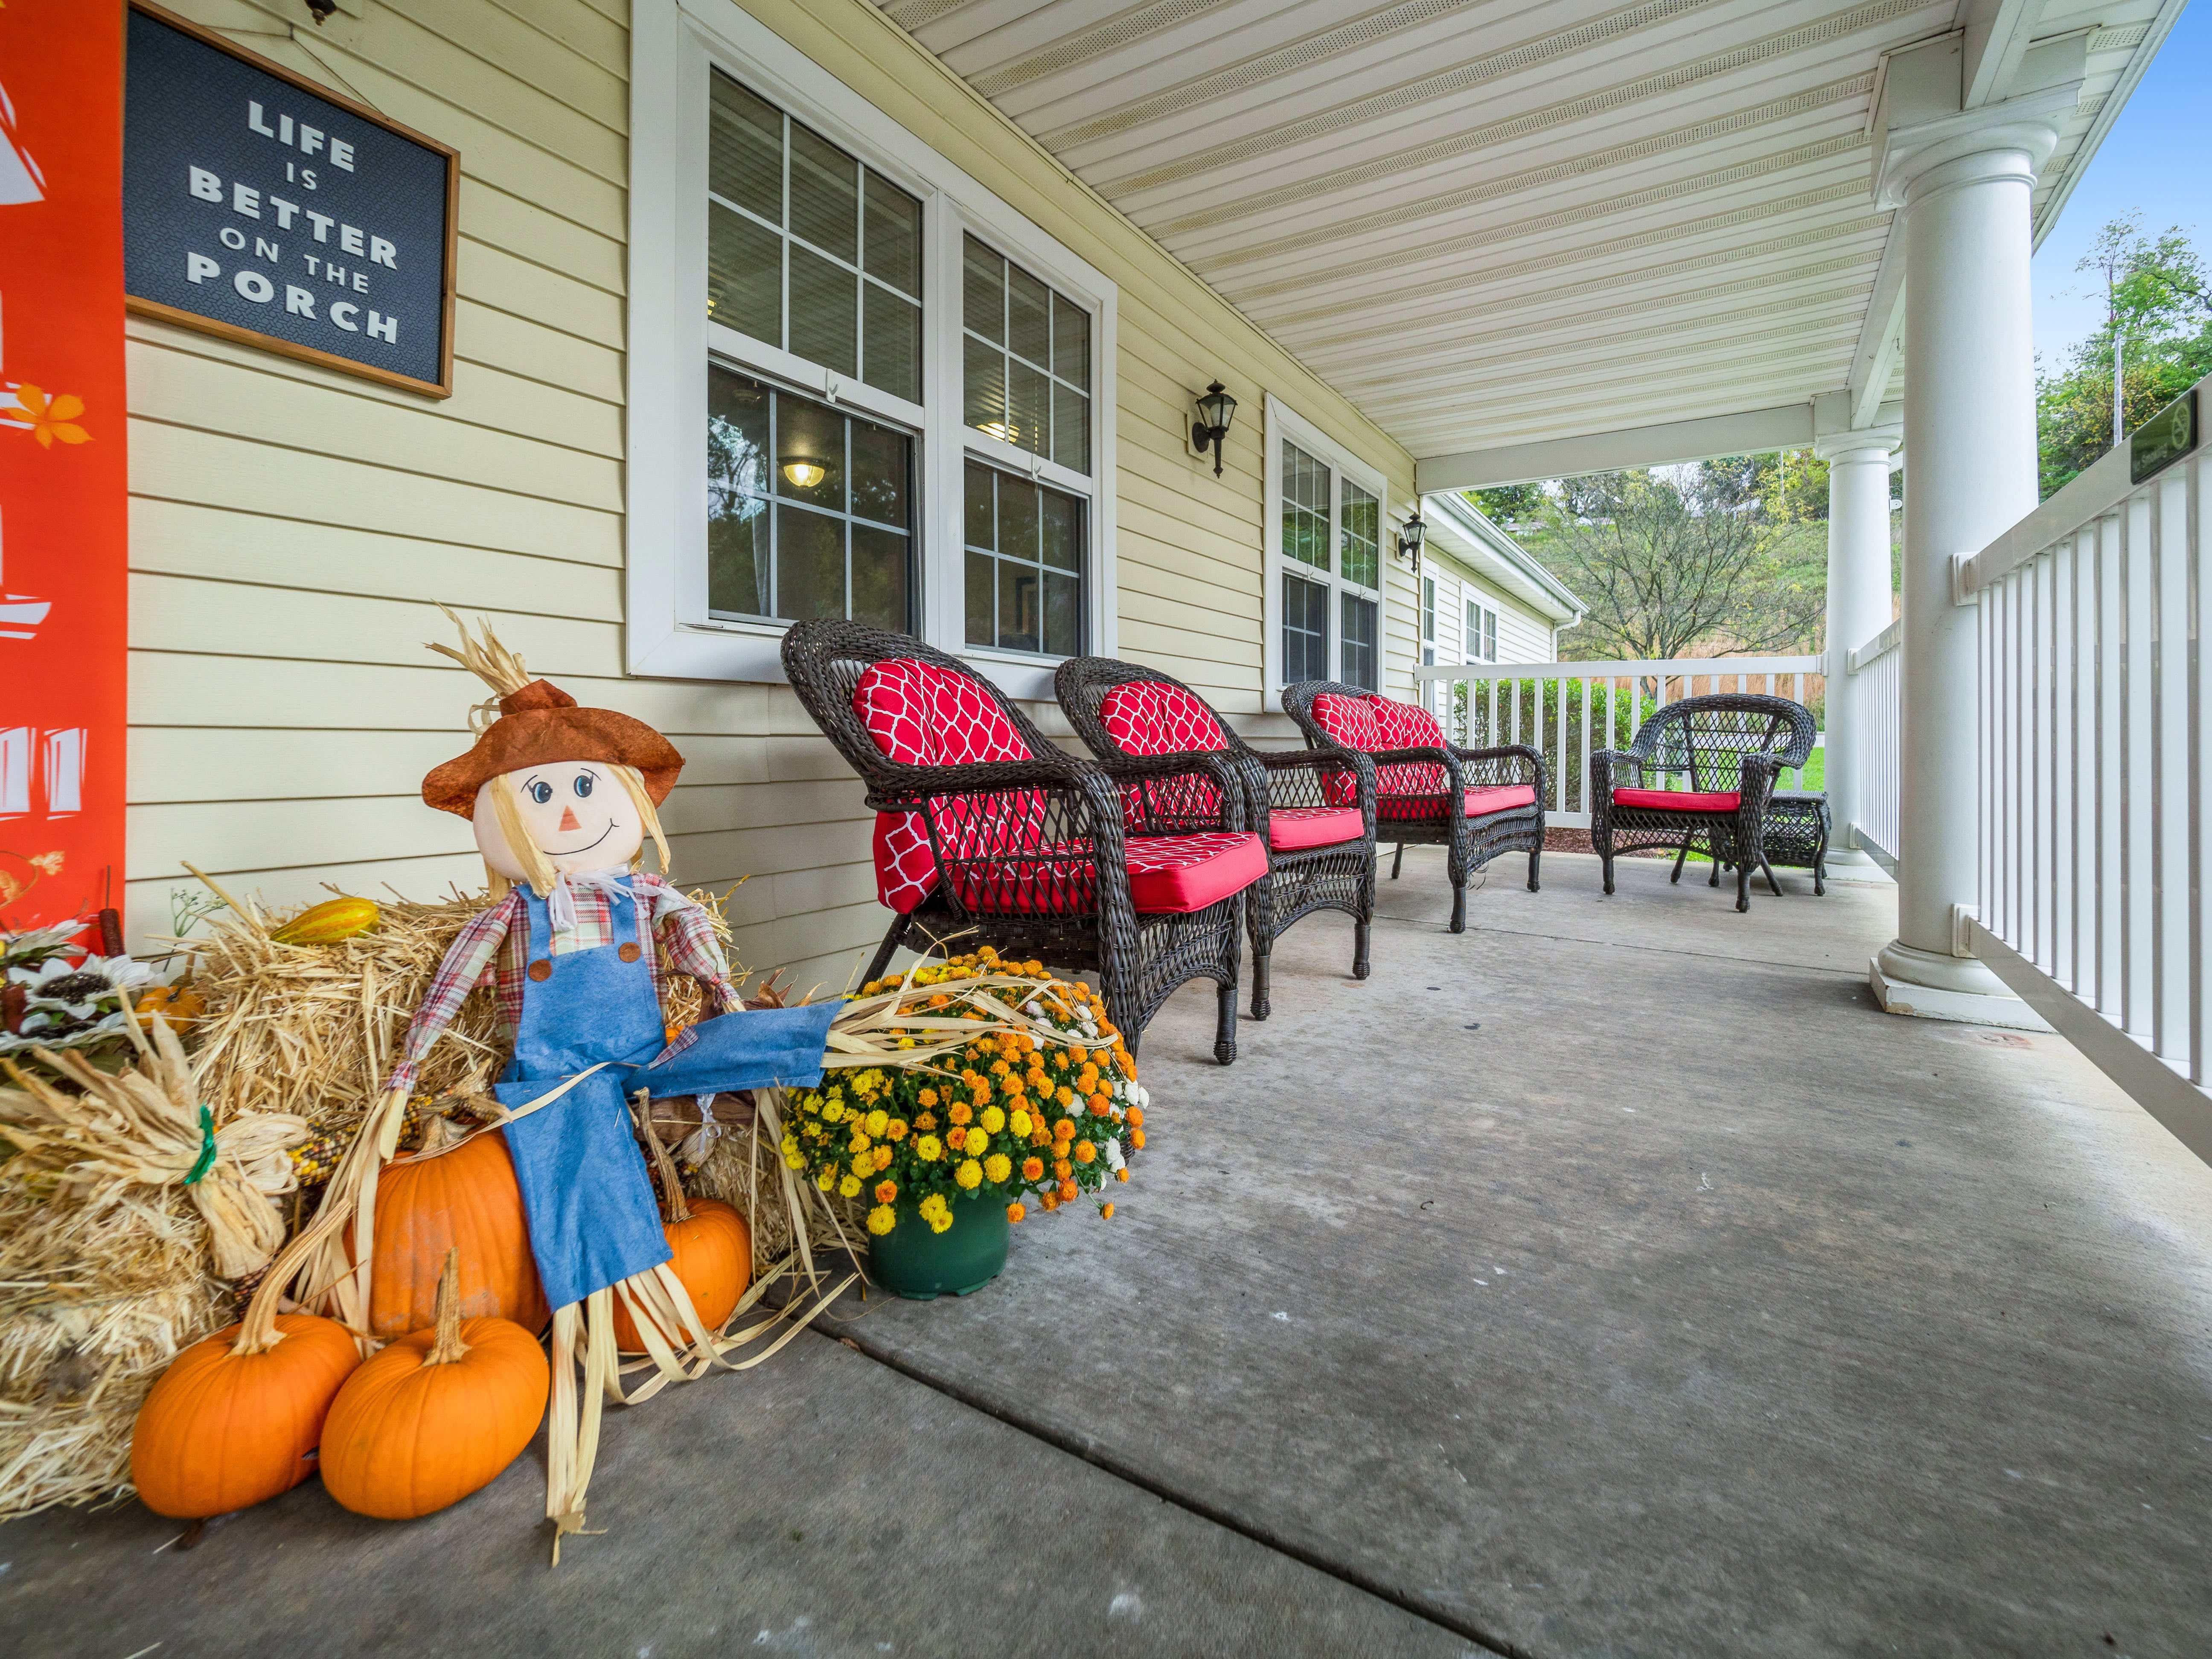
Logan Place
139 Craigdell Road, Lower Burrell, PA 15068 (1.9 mi from city center)The Addison of Logan Place is an assisted living facility in Lower Burrell, PA, providing personalized care plans, a variety of activities, and a range of amenities in a serene environment.

Parnassus Manor
325 Main St, New Kensington, PA 15068 (3.1 mi from city center)Parnassus Manor is a premier assisted living community offering specialized diabetic care services and holistic senior living activities.

East Deer Personal Care Home
967 Freeport Rd, Creighton, PA 15030 (3.3 mi from city center)East Deer Personal Care Home provides exceptional care for seniors with a clean, efficient facility, outstanding food service, attentive nursing staff, and engaging activities.
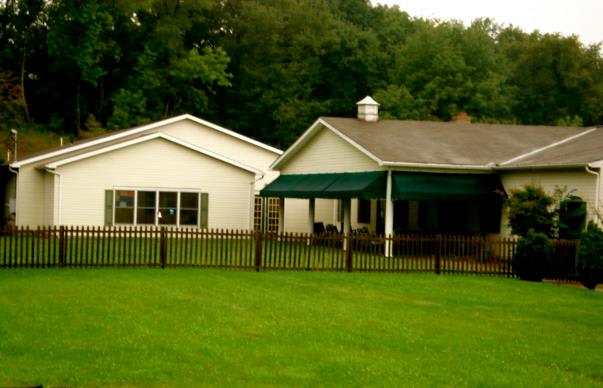
Pleasant Ridge Mature Living
981 Pleasant Hill Rd, Leechburg, PA 15656 (5.6 mi from city center)Pleasant Ridge Mature Living is a family-owned and operated personal care residence designed to meet the changing needs of seniors who want to remain independent but need a little extra assistance in their daily routines.

The Villages of Harmar
715 Freeport Rd, Cheswick, PA 15024 (6.1 mi from city center)The Villages of Harmar is a 133 bed assisted living community with private and companion suites, offering personalized assisted living services and a memory care neighborhood.

Plum Creek Acres
501 Center New Texas Rd, Pittsburgh, PA 15239 (6.7 mi from city center)Plum Creek Acres is a senior apartment facility located at 501 Center New Texas Rd, Pittsburgh, PA 15239.

Westminster Place of Oakmont
1215 Hulton Rd, Oakmont, PA 15139 (7.2 mi from city center)Westminster Place of Oakmont offers a range of senior living options, including independent living, assisted living, skilled nursing, and short-term rehabilitation.

Home Instead - Oakmont, PA
661 Allegheny Ave, Oakmont, PA 15139 (7.9 mi from city center)Home Instead Oakmont, PA provides in-home care services tailored to individual needs, including 24-hour care, home helper services, hospice care support, personal care services, respite care, and Alzheimer’s care.

Adult Living At Rosebrook
723 S Pike Rd, Sarver, PA 16055 (8.1 mi from city center)Adult Living At Rosebrook provides assisted living and memory care services in a home-like atmosphere.
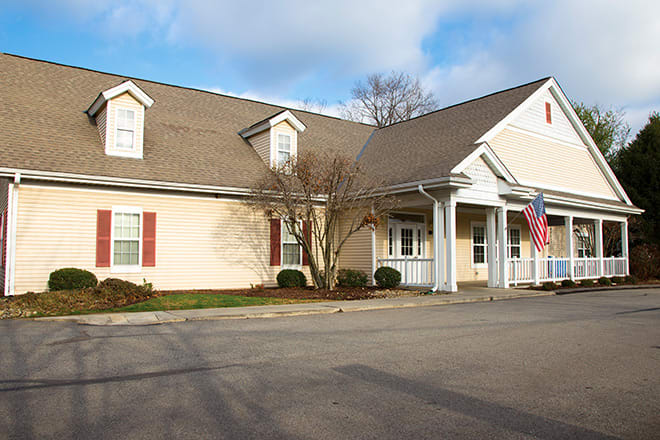
Brookdale Penn Hills
7151 Saltsburg Road, Penn Hills, PA 15235 (8.4 mi from city center)Brookdale Penn Hills is a personal care home offering assisted living and memory care services.

Pine View Personal Care Facility
1113 Pine View Ln, Vandergrift, PA 15690 (8.7 mi from city center)Pine View Personal Care Facility is a licensed personal care home providing assisted living services.

A J Demor Towers
1 Demor Dr, Verona, PA 15147 (8.8 mi from city center)A J Demor Towers is a senior living facility offering independent living services to residents 62 and older.

Beatty Pointe Village
700 Beatty Rd, Monroeville, PA 15146 (9.6 mi from city center)Beatty Pointe Village is a senior living community that focuses on providing independent living care.
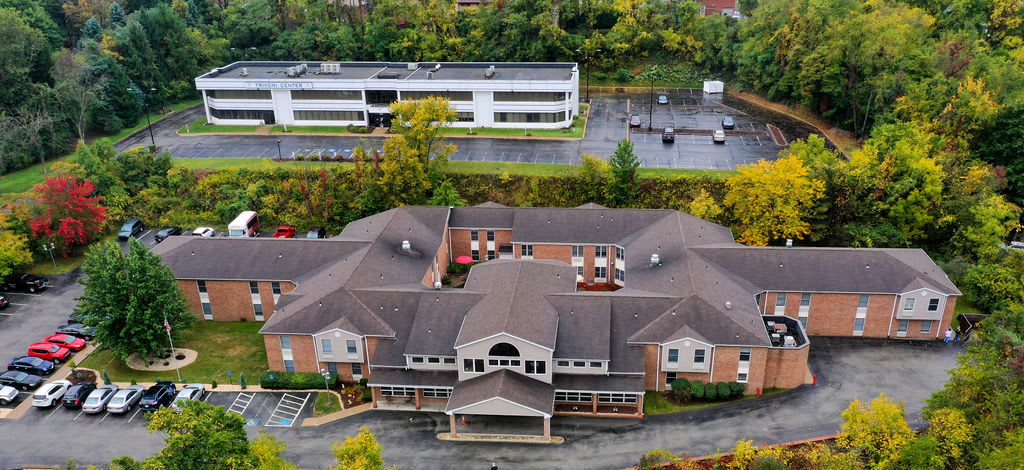
Independence Court of Monroeville
279 Center Road, Monroeville, PA 15146 (10 mi from city center)Independence Court of Monroeville is a senior living community offering enhanced personal care, memory care, short-term respite stays, and hospice coordination in Monroeville, PA.

Concordia of Monroeville
4363 Northern Pike, Monroeville, PA 15146 (10.3 mi from city center)Concordia of Monroeville offers personal care, short-term rehabilitation, and long-term nursing care in a comfortable and homelike environment.
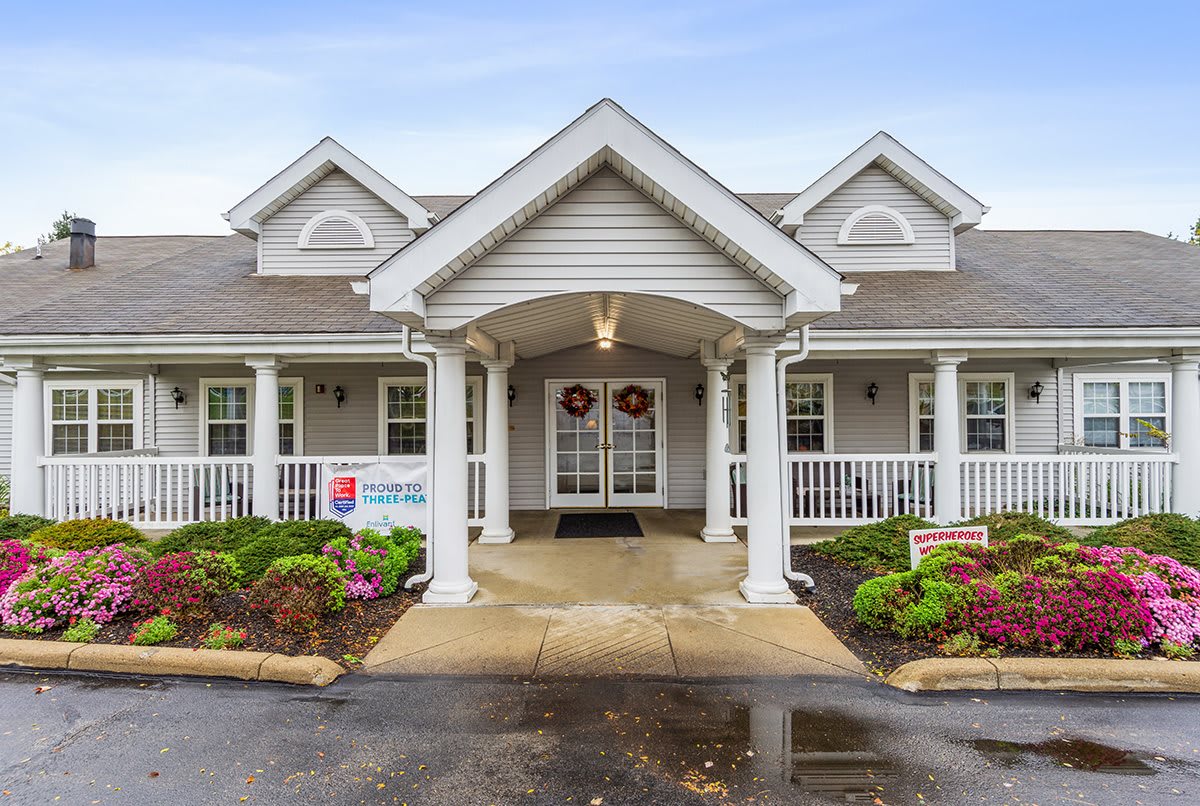
Allegheny Place
10960 Frankstown Rd., Penn Hills, PA 15235 (10.4 mi from city center)Allegheny Place is an assisted living community located in Penn Hills, PA, offering studio and 1-bedroom apartments with kitchenettes and built-in safety features.
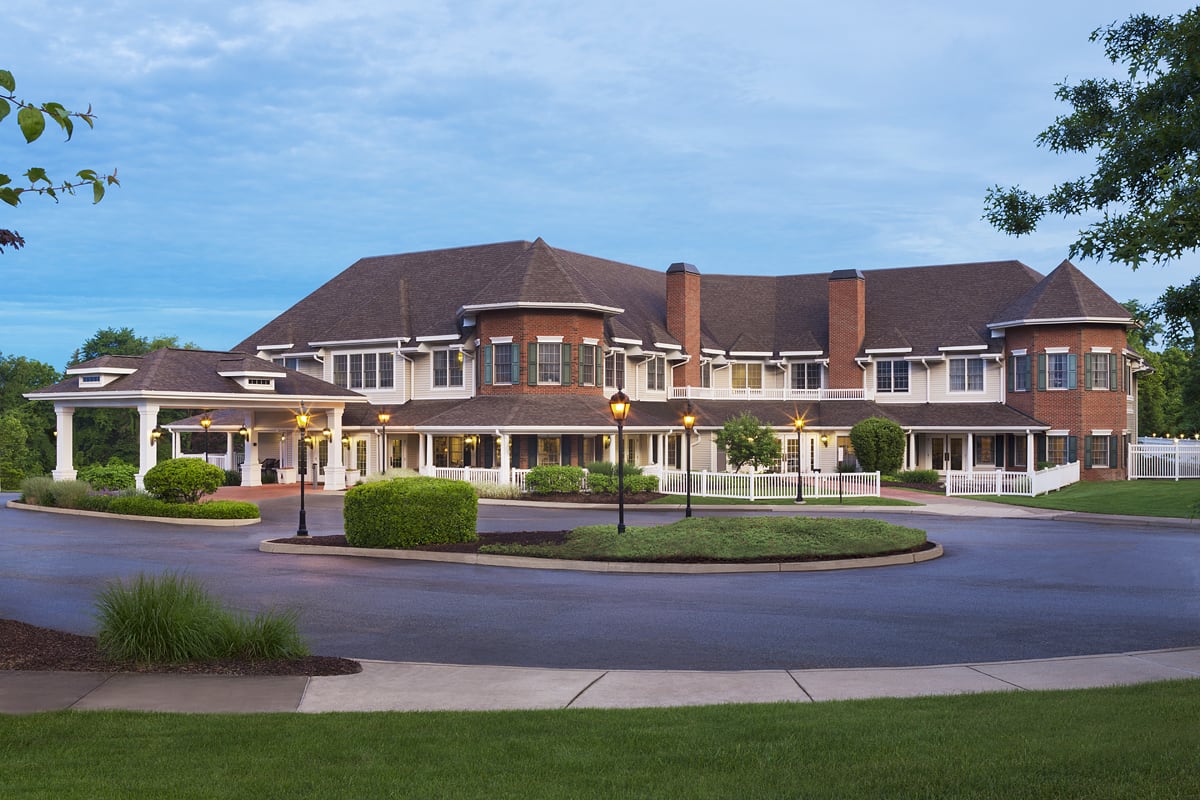
Juniper Village at Monroeville
2589 Mosside Blvd, Monroeville, PA 15146 (10.7 mi from city center)Juniper Village at Monroeville provides senior living including personal care and Wellspring memory care in a quiet, yet active community setting.
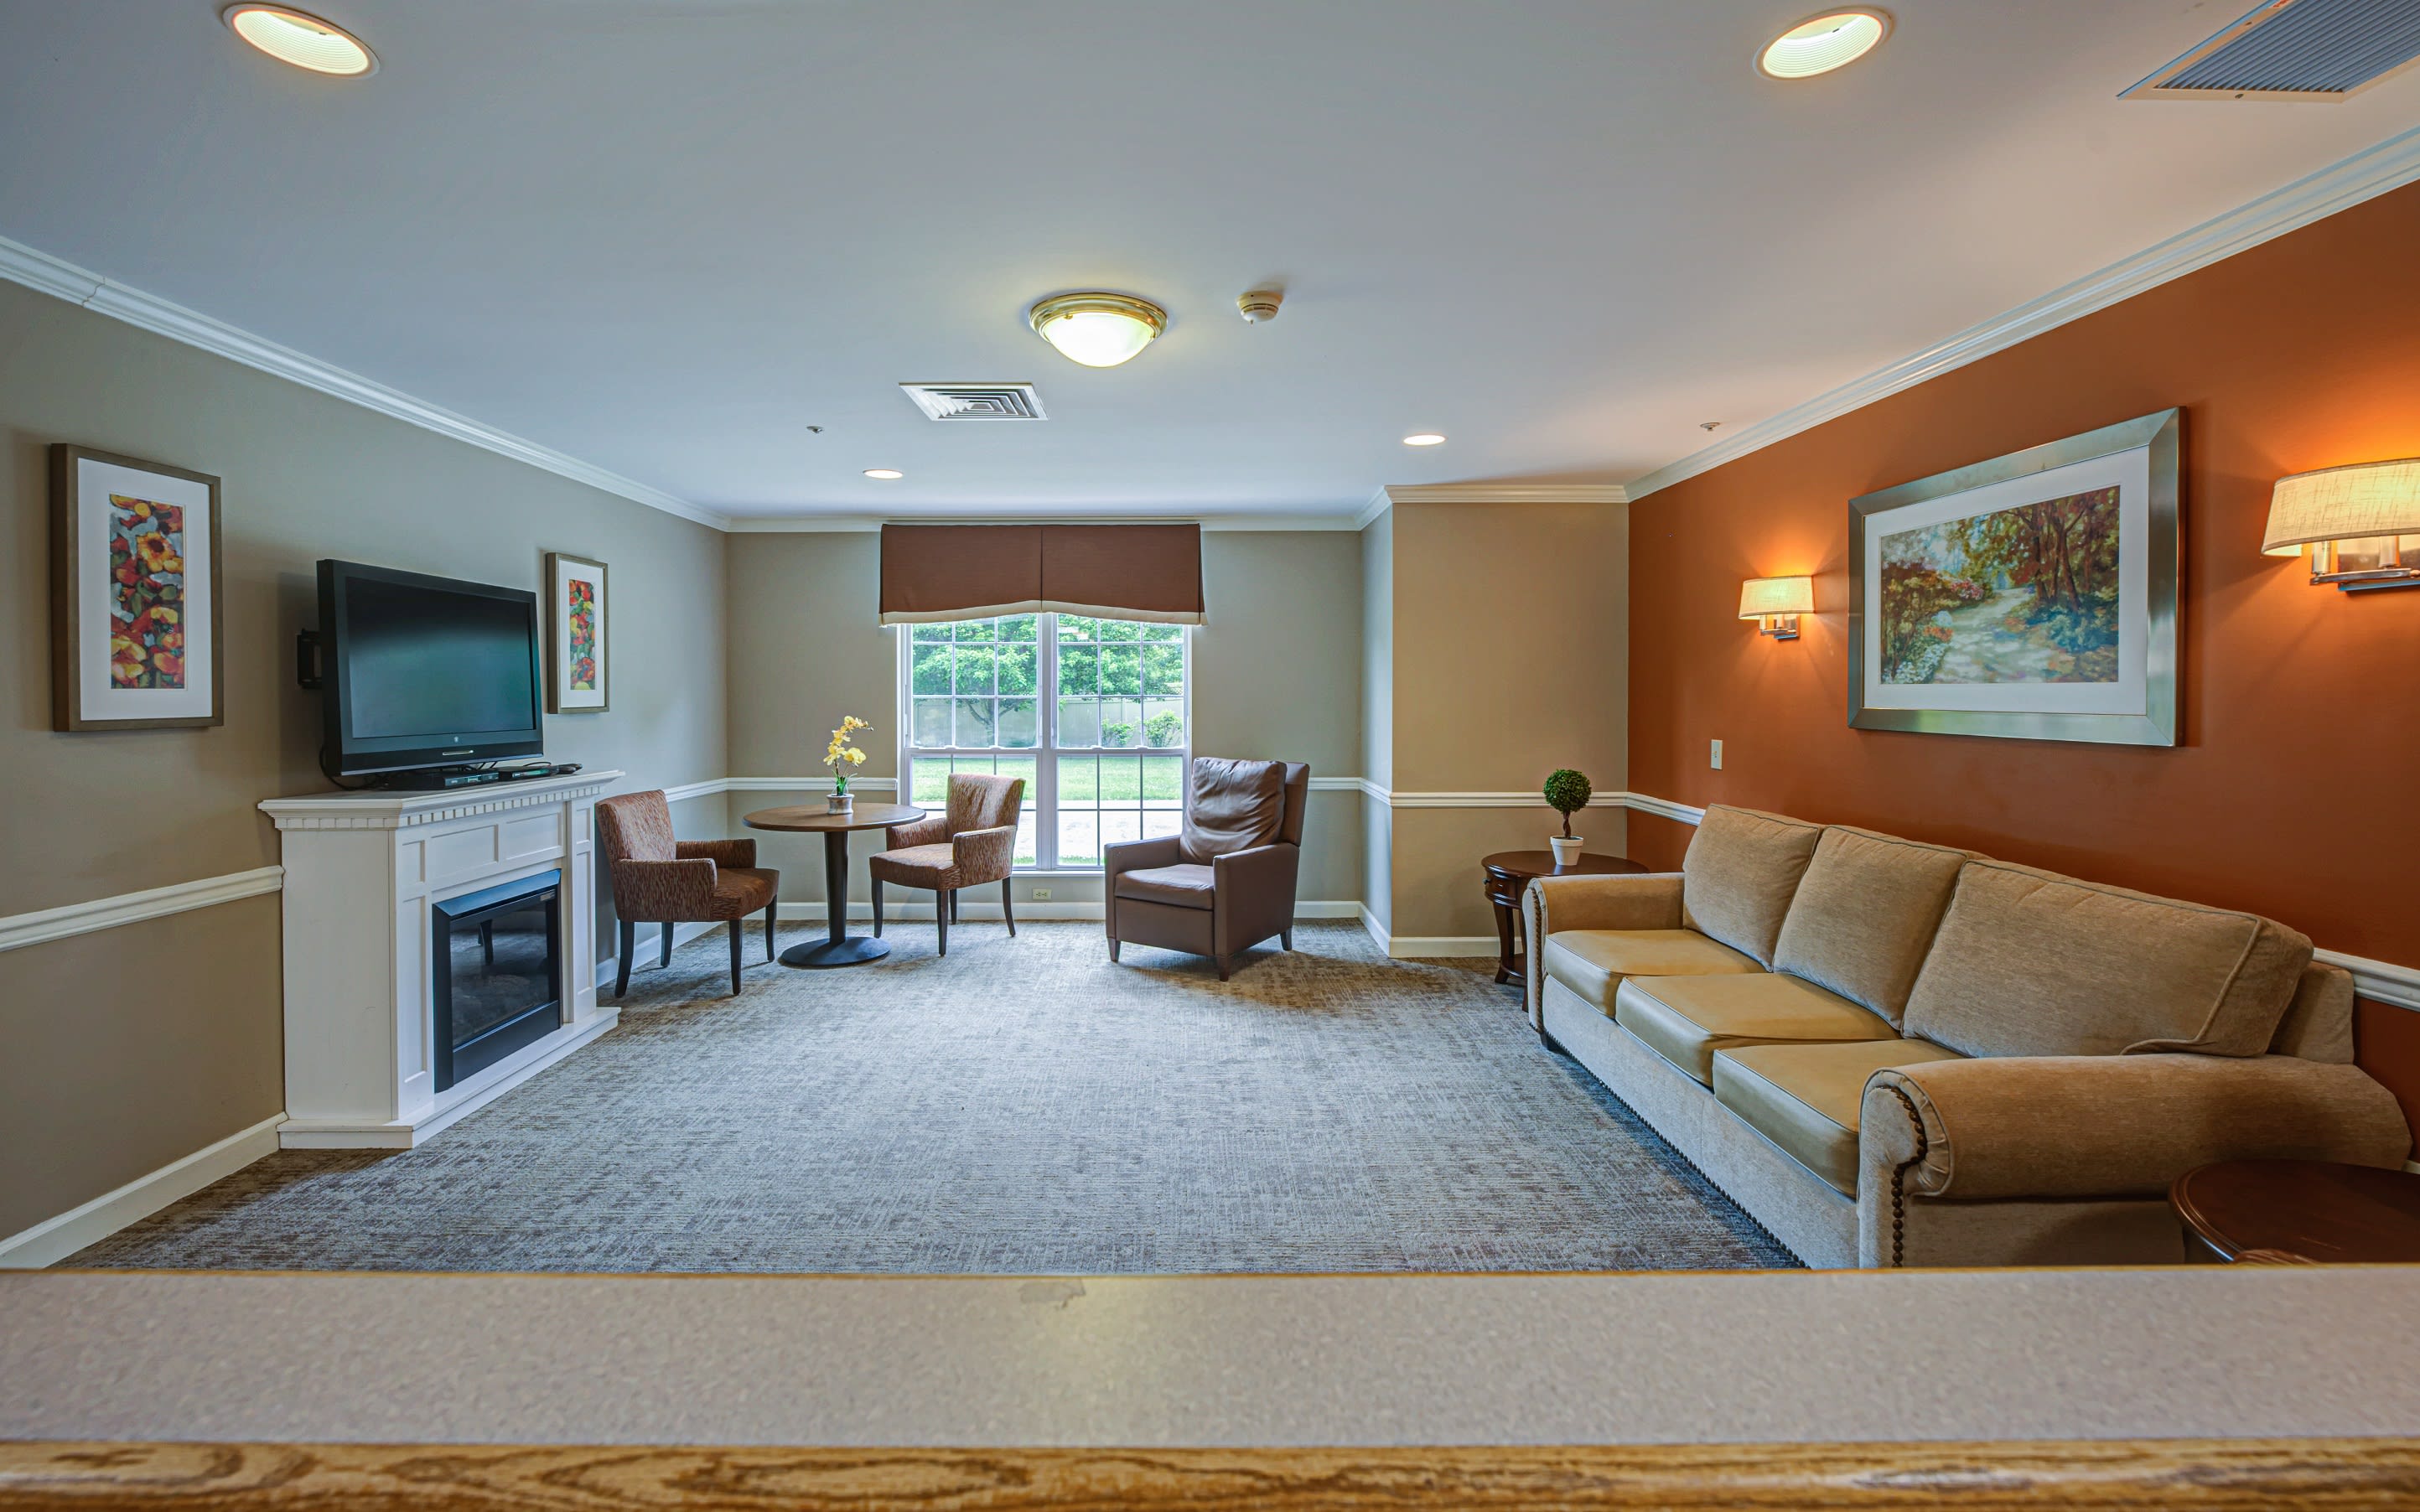
Arden Courts A ProMedica Memory Care Community in Monroeville
120 Wyngate Dr, Monroeville, PA 15146 (10.8 mi from city center)Arden Courts A ProMedica Memory Care Community in Monroeville provides quality memory care to seniors in a home-like atmosphere with research-based design elements.
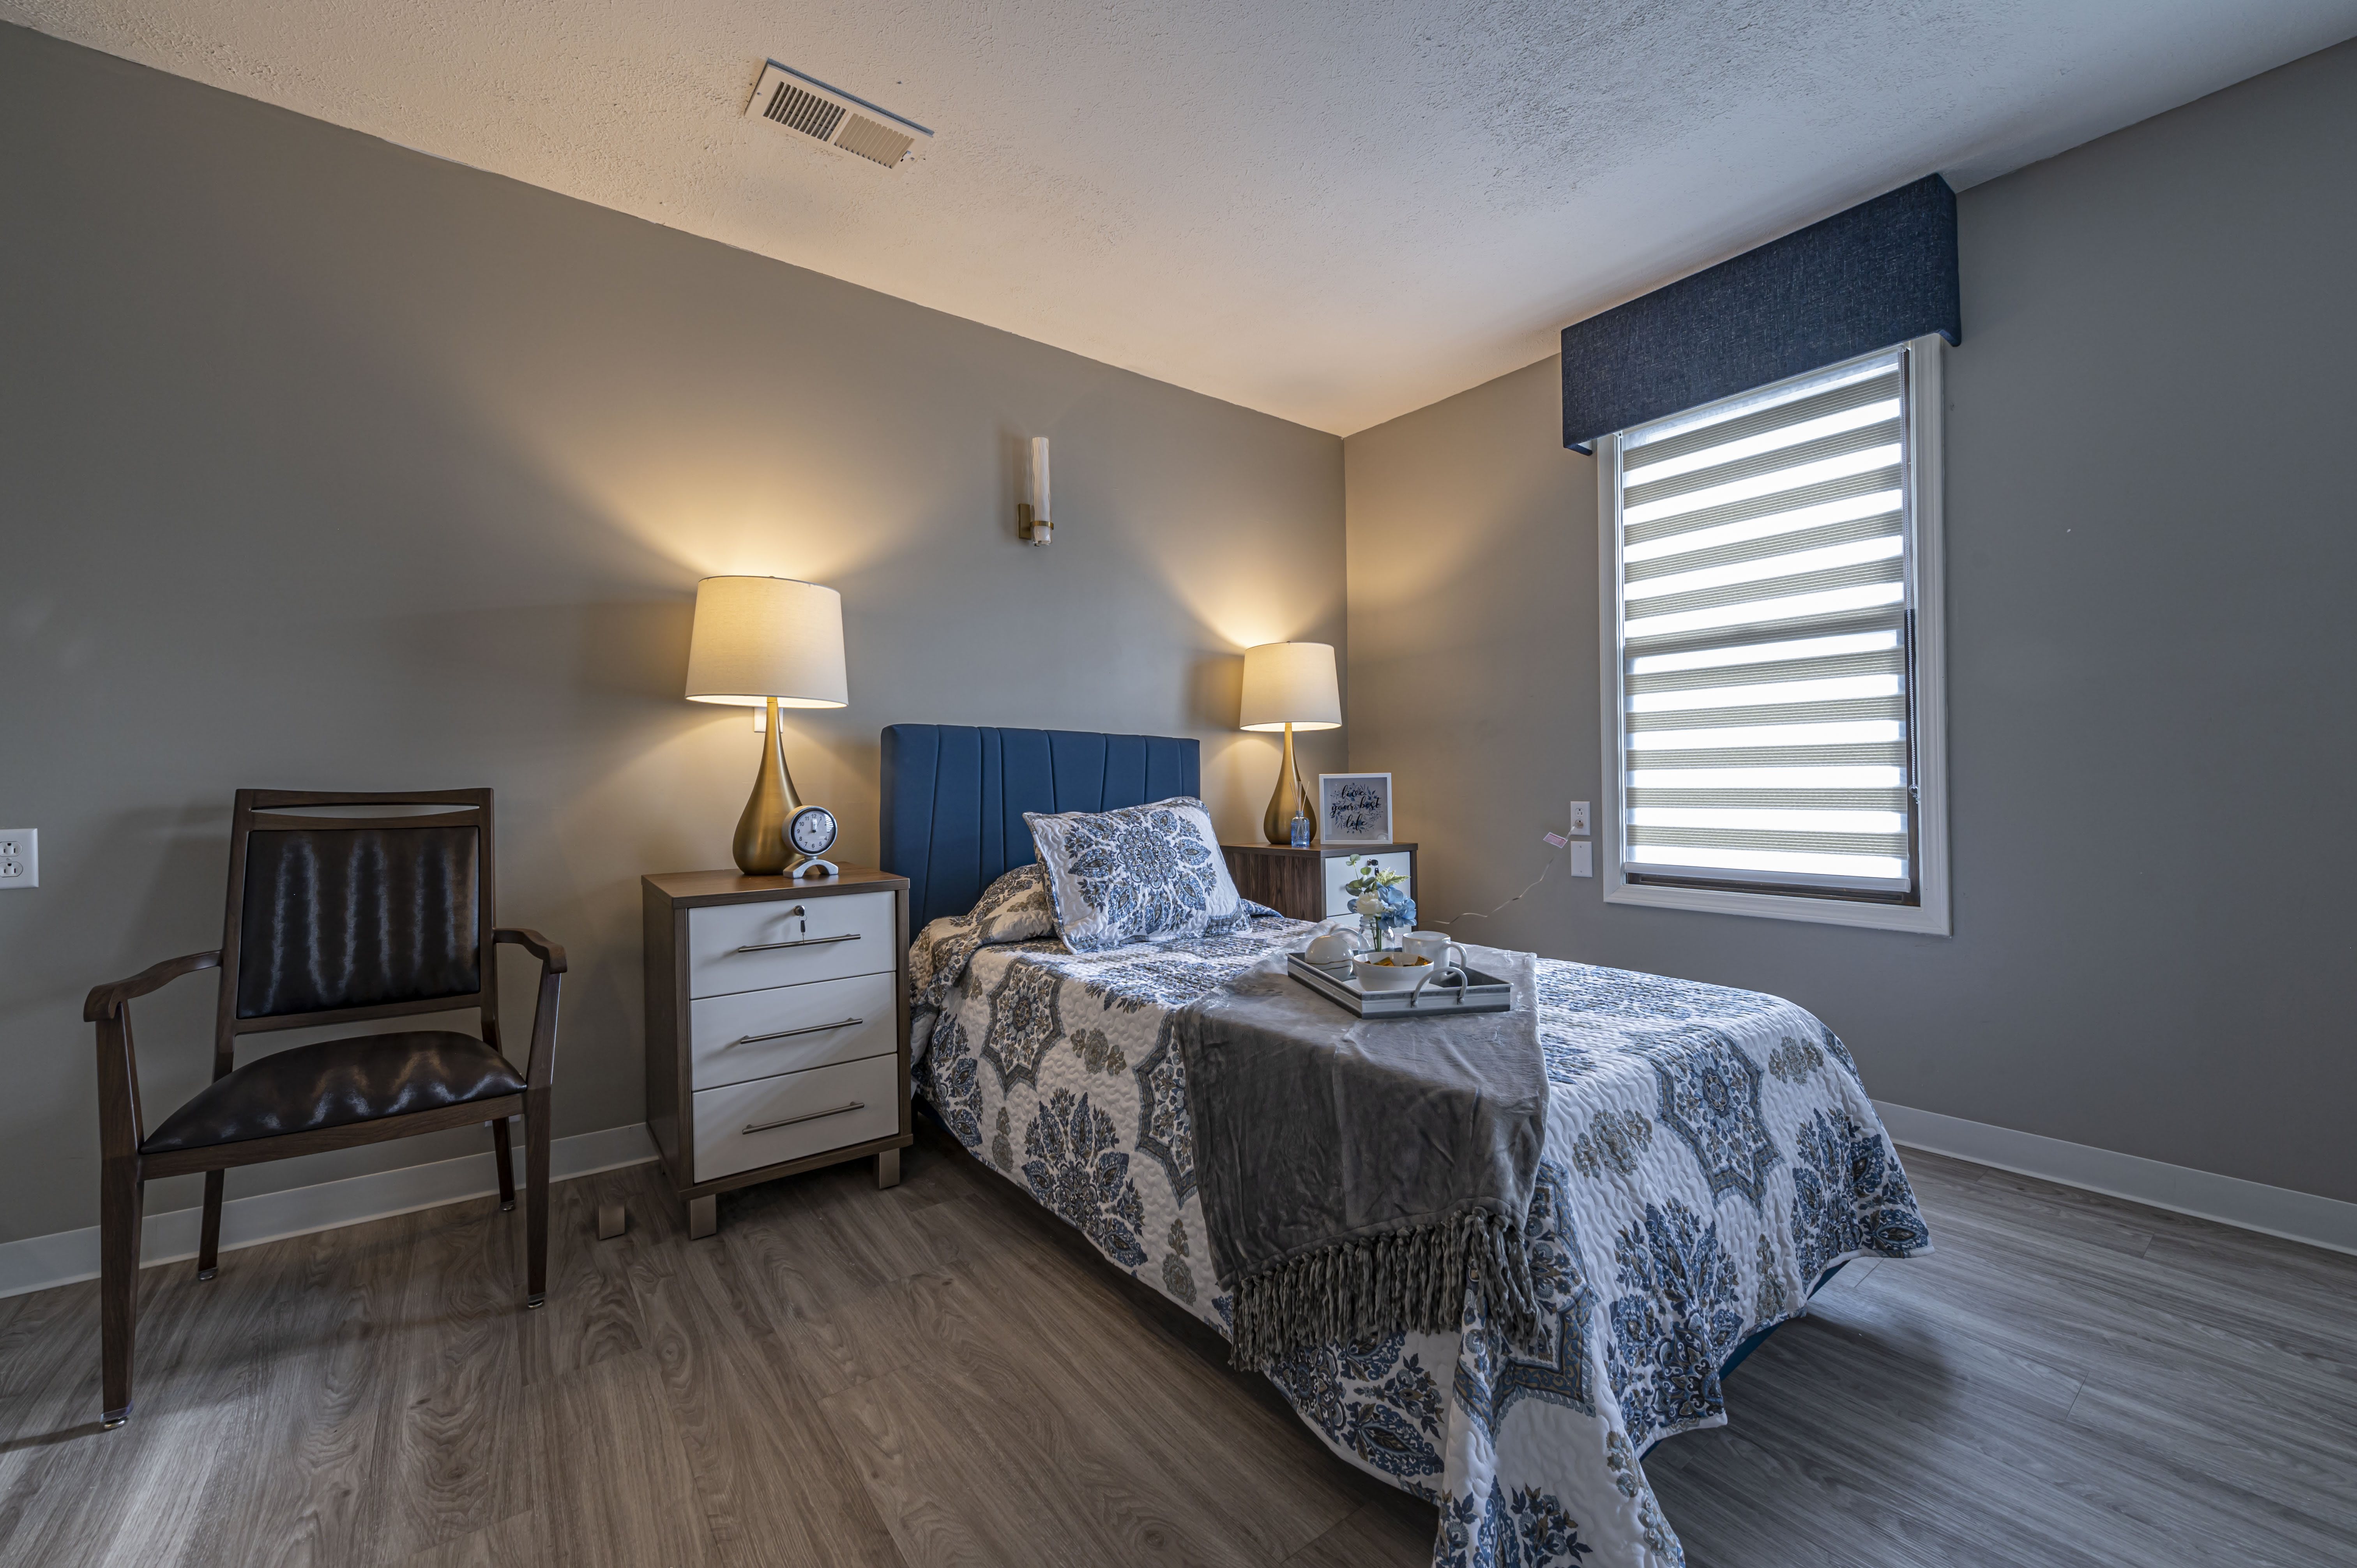
Abode Care of Monroeville
2560 Stroschein Rd, Monroeville, PA 15146 (10.9 mi from city center)Abode Care of Monroeville is a stunning newly remodeled community situated in a beautiful park-like setting, offering assisted living services.

Douglas Plaza Apartments
2407 Laketon Rd, Pittsburgh, PA 15221 (11.6 mi from city center)Douglas Plaza Apartments is an affordable housing community for applicants 50 years or older, offering one-bedroom apartments with utilities included.
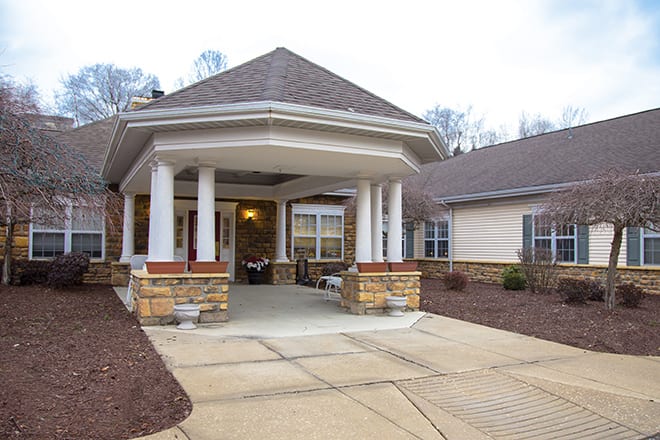
Brookdale Murrysville
5300 Old William Penn Highway, Export, PA 15632 (11.7 mi from city center)Brookdale Murrysville is a memory care community providing person-centered care for seniors with Alzheimer's and dementia.
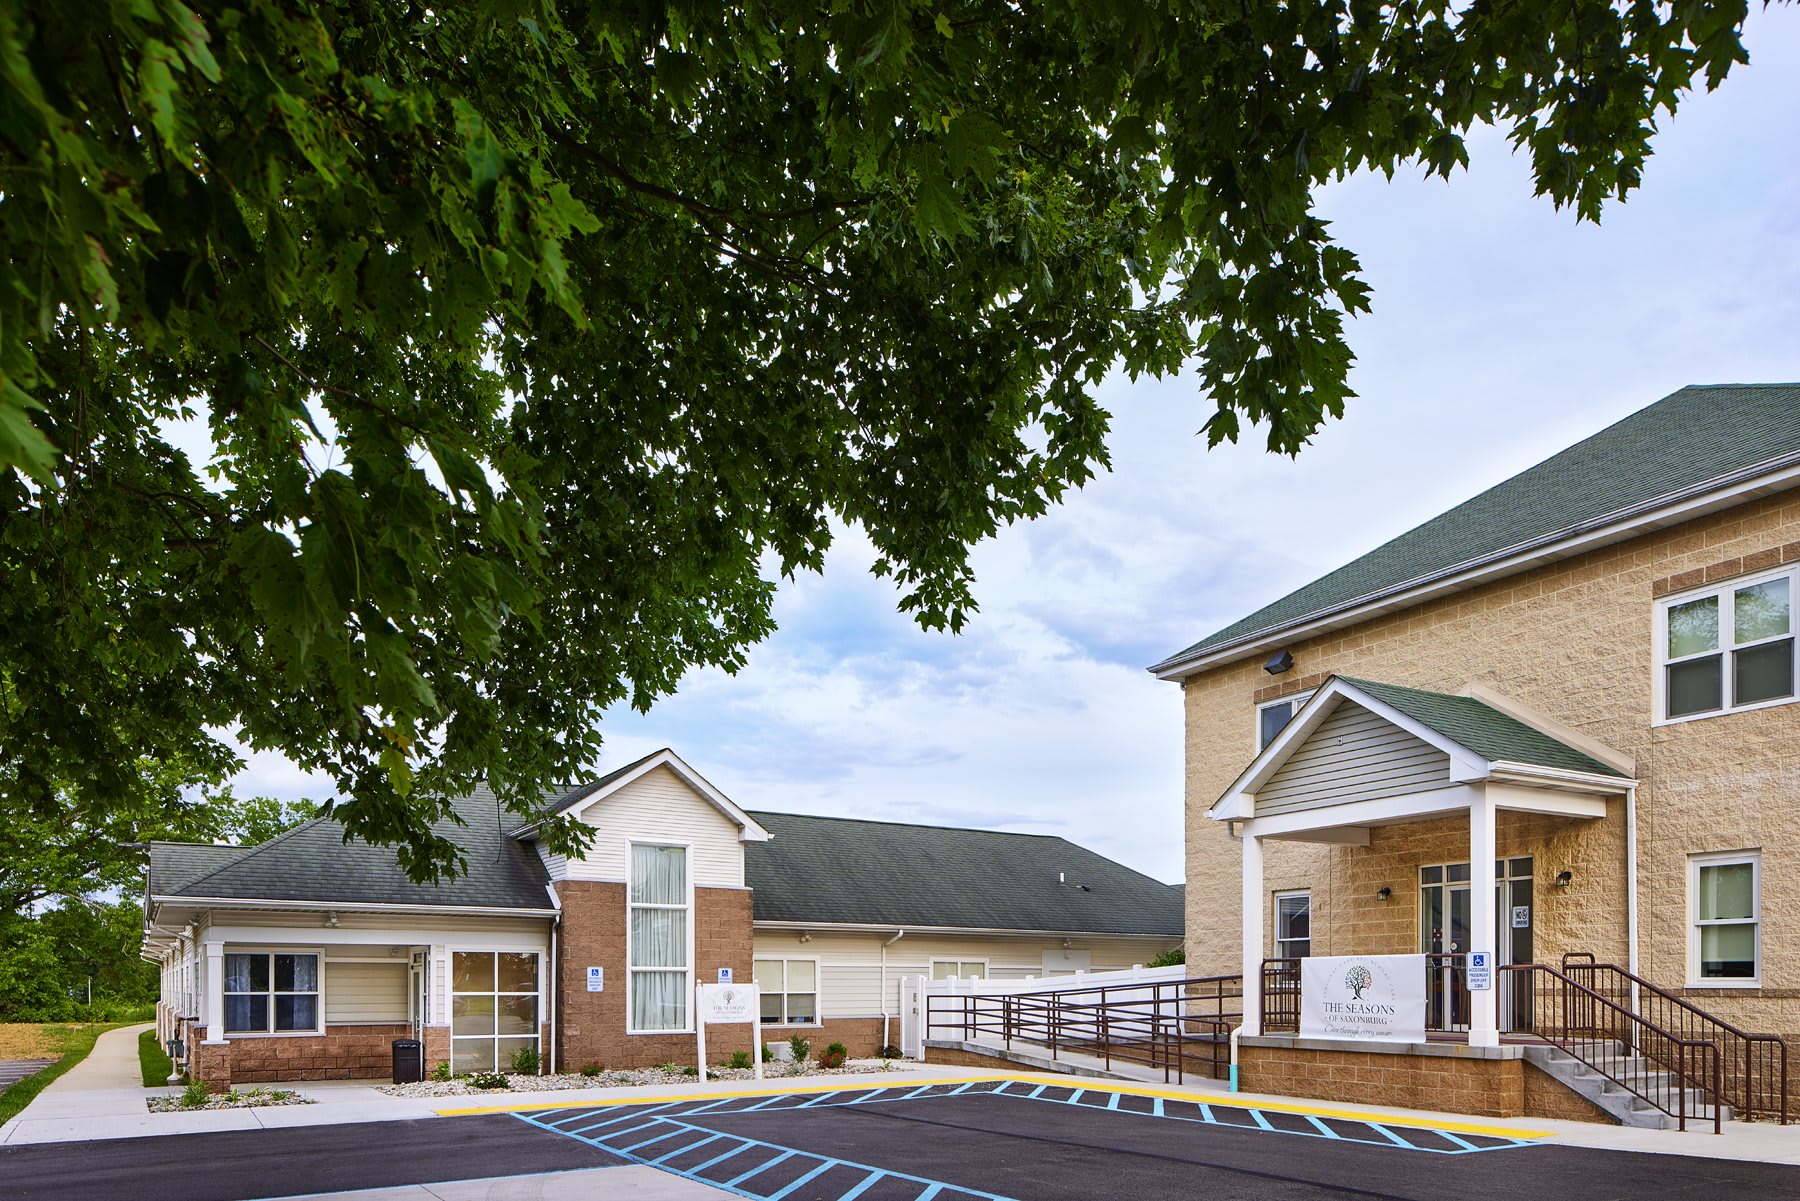
The Seasons of Saxonburg
223 Pittsburgh St, Saxonburg, PA 16056 (12.5 mi from city center)The Seasons of Saxonburg is a stunning, newly renovated personal and memory care community providing exceptional care in a homelike setting.
Map of Assisted Living in Lower Burrell
Find the right senior living community by location- Lower Burrell Manor
- Bayberry Place
- Westarm Therapy & Homecare
- Logan Place
- Parnassus Manor
- East Deer Personal Care Home
- Pleasant Ridge Mature Living
- The Villages of Harmar
- Plum Creek Acres
- Westminster Place of Oakmont
- Home Instead - Oakmont, PA
- Adult Living At Rosebrook
- Brookdale Penn Hills
- Pine View Personal Care Facility
- A J Demor Towers
- Beatty Pointe Village
- Independence Court of Monroeville
- Concordia of Monroeville
- Allegheny Place
- Juniper Village at Monroeville
- Arden Courts A ProMedica Memory Care Community in Monroeville
- Abode Care of Monroeville
- Douglas Plaza Apartments
- Brookdale Murrysville
- The Seasons of Saxonburg
- Magnolia Place of Saxonburg
- Harmony at Harts Run
- Juniper Village at Forest Hills
- LGAR Health & Rehab Ctr
- Reward Senior Care
- Graceful Care Living
- Arcadia Home Care & Staffing Pittsburgh
- Terrace Place at Vincentian
- Home Instead - Pittsburgh, PA
- Ark Manor
- Trafford Manor
- Concordia Haven Apartments
- William Penn Care Center
- William Penn Senior Suites and Personal Care
- Evening Star Inc.
- Celebration Villa of Allison Park
- Orion Personal Care Residence
- Shady Park Place
- General Braddock Towers
- Manorcare Health Services Shadyside
- PRN Health Svc Inc
- Gardens of Lincoln Court
- Harry and Jeannette Weinberg Terrace
- Point Pleasant
- Grace Manor at North Park
Senior Living Statistics for Lower Burrell, Pennsylvania
Average Senior Living Costs by Housing Type
Senior housing in Lower Burrell, Pennsylvania, offers various options, starting at an average of $2,984 per month for a semi-private room in a nursing home. Other choices include assisted living at $4,479 per month, memory care at $4,713 per month, independent living at $5,737 per month, and a studio nursing home at $4,450 per month. A private room in a nursing home averages $3,792 per month.
| Housing Type | Average Monthly Cost |
|---|---|
| Assisted Living | $4,479 |
| Memory Care | $4,713 |
| Independent Living | $5,737 |
| Nursing Home: Private Room | $3,792 |
| Nursing Home: Semi-Private Room | $2,984 |
| Nursing Home: Studio | $4,450 |
Average Cost of Assisted Living in Lower Burrell
The average monthly cost of assisted living in Lower Burrell is 4479. Depending on the level of care and community features chosen, expenses can vary, but generally, the city is pricier than nearby locations. For example, assisted living in Vandergrift averages $3,303 per month, while in Apollo, it averages $3,340 per month. Lower Burrell is slightly higher than the Pennsylvania state average of $4,271 and is close to the national average of $4,546.
| City | Average Monthly Cost |
|---|---|
| Lower Burrell | $4,479 |
| Vandergrift | $3,303 |
| Apollo | $3,340 |
Here is how the average cost of assisted living in Lower Burrell compares to Pennsylvania and the national average:
| Area | Average Monthly Cost |
|---|---|
| Lower Burrell | $4,479 |
| Pennsylvania | $4,271 |
| United States | $4,546 |
Senior Living Availability in Lower Burrell
Lower Burrell offers several options for senior living communities - 4 to be exact. For those who are not set on living in Lower Burrell, there are 184 facilities in the surrounding area and 918 throughout Pennsylvania.
Lower Burrell
Surrounding Area
Pennsylvania
Lower Burrell Senior Demographics
45.9% of Lower Burrell residents are seniors, highlighting a significant elderly demographic. Within the city, 11.2% are in their 50s, 15.6% are in their 60s, 10.7% are in their 70s, and 8.4% are in their 80s. The gender distribution includes 50.3% male and 49.7% female. In terms of marital status, 55.2% are married, 10.4% are divorced, 24.3% never married, and 10.2% widowed. The population's diversity features 95.5% White, 3.1% mixed race, and 0.9% Hispanic.
Population
Lower Burrell has a population of 11,659.- 50.3% Male
- 49.7% Female
Marital Status
- 55.2% Married
- 10.4% Divorced
- 24.3% Never Married
- 10.2% Widowed
Age
Seniors make up about 45.9% of the population.- 11.2% in their 50s
- 15.6% in their 60s
- 10.7% in their 70s
- 8.4% in their 80s
Diversity
- 95.5% White
- 0.8% Black
- 0.4% Asian
- 0.1% Native
- 0.1% Pacific
- 3.1% Mixed Race
- 0.9% Hispanic
Additional Cities with Assisted Living Near Lower Burrell
The average cost of senior living in cities near Lower Burrell, Pennsylvania varies widely. Some of the more affordable options include Uniontown ($2,614 per month), Greensburg ($3,014 per month), and Latrobe ($3,158 per month). A few moderately-priced options include Bethel Park ($3,551 per month), Monroeville ($3,514 per month), and North Versailles ($3,479 per month). Some of the most expensive options include Wexford ($4,525 per month), Mars ($4,495 per month), and New Castle ($5,813 per month).
| City | Average Monthly Cost |
|---|
| City | Average Monthly Cost |
|---|---|
| Pittsburgh | $4,249 |
| Greensburg | $3,014 |
| Bethel Park | $3,551 |
| Monroeville | $3,514 |
| New Castle | $5,813 |
| Uniontown | $2,614 |
| Latrobe | $3,158 |
| Bridgeville | $4,389 |
| Mars | $4,495 |
| City | Average Monthly Cost |
|---|---|
| Wexford | $4,525 |
| Penn Hills | $4,221 |
| North Huntingdon | $3,418 |
| Munhall | $4,222 |
| North Versailles | $3,479 |
| Beaver Falls | $5,178 |
| Jeannette | $3,247 |
| Oakmont | $4,278 |
| Mckees Rocks | $4,316 |
